
More Information
Submitted: 03 February 2020 | Approved: 13 February 2020 | Published: 14 February 2020
How to cite this article: Che JX, Wu Y, Chang SJ, Chen CJ, Liu JT. Peptide-based antifouling aptasensor for cardiac troponin I detection by surface plasmon resonance applied in medium sized Myocardial Infarction. Ann Biomed Sci Eng. 2020; 4: 001-008.
DOI: 10.29328/journal.abse.1001007
Copyright License: © 2020 Che JX, et al. This is an open access article distributed under the Creative Commons Attribution License, which permits unrestricted use, distribution, and reproduction in any medium, provided the original work is properly cited.
Keywords: Aptasensor; Cardiac troponin I; Antifouling; Surface plasmon resonance; Myocardial Infarction

Peptide-based antifouling aptasensor for cardiac troponin I detection by surface plasmon resonance applied in medium sized Myocardial Infarction
Jia Xin Che1,2, Yi Wu3, Shwu Jen Chang4, Ching-Jung Chen1,5* and Jen-Tsai Liu1,6*
1Research Center for Materials Science and Opti-Electronic Technology, University of Chinese Academy of Sciences, No.19A Yuquan Road, Beijing 100049, China
2School of Electronic, Electrical and Communication Engineering, University of Chinese Academy of Sciences, P.R.China
3School of Physics, University of Chinese Academy of Sciences, P.R. China
4Department of Biomedical Engineering, I-Shou University, Kaohsiung City, 82445, Taiwan
5School of Opto-Electronic Technology, University of Chinese Academy of Sciences, P.R. China
6College of Materials Science and Opto-Electronic Technology, University of Chinese Academy of Sciences, P.R. China
*Address for Correspondence: Ching-Jung Chen, School of Opto-Electronic Technology, University of Chinese Academy of Sciences, P.R. China, Tel: +86 13261037737; Email: [email protected]
Dmitriy Linnik, Donetsk National University, 17a Schorsa Str. Donetsk, Ukraine, Email: [email protected]
Highly selective and sensitive detection of cardiac troponin I (cTnI) is a powerful complement to clinical diagnosis of acute myocardial infarction (AMI). In this study, a strategy for cTnI detection was developed by constructing a universal biosensing interface composed of zwitterionic peptides and aptamers. The peptides were self-assembled onto gold chips, and some of them were biotinylated. The cTnI-specific binding aptamers were immobilized through the streptavidin-biotin system. Surface plasmon resonance (SPR) measurements revealed the preparation process. The developed aptasensor presents a linear detection with cTnI ranging from 20 ng/ml to 600 ng/ml and a detection limit of 20 ng/ml. The high immobilization of the aptamer enhances the sensitivity of the aptasensor and the calculated KD was 6.75 nM. Due to the outstanding antifouling property of the zwitterionic peptide, the developed aptasensor possesses a high resistance towards protein fouling. Moreover, the aptasensor has excellent selectivity and specificity towards cTnI in complex media. Hence, the proposed peptide-based aptasensor shows great potential for practical application in medium sized Myocardial Infarction (MI).
Although medical technology has notably improved globally, the mortality and morbidity of cardiovascular diseases (CVDs) remain high. According to the World Health Organization (WHO), annual death toll caused by CVDs would possibly reach to 22.2 million by 2030 [1]. AMI is the leading cause of deaths of CVD patients, which is mainly related to atherosclerotic thrombosis limiting the flow of blood and causing myocardial cell death due to prolonged myocardial ischemia [2]. The traditional method for MI diagnoses was electrocardiography (ECG). However, 25% of MIs happen without symptoms, for which the ECG results give no indication [3,4]. Diagnostic results by ECG can only reflect the current status of patients. Thus, this method requires multiple measurements to fully understand the patients’ clinical conditions along with subjective interpretation of physicians [5].
According to the fourth universal definition of myocardial infarction (MI) released by European Society of Cardiology (ESC), clinical criteria for MI is the existence of acute myocardial injury detected by the abnormity of cardiac biomarkers under the circumstance of acute myocardial ischaemia [6]. The decision concentration level of myocardial injury called URL (upper reference limit) is 99 percentile of the normal range produced by certain assay with coefficient of variation (CV) < 10% [6,7]. There is no standard value for 99 percentile URL, but each company will provide their own reference data based on differences in assays and reagents [8,9]. Compared with the disadvantages and limitations of ECG in the diagnosis of MI, cardiac biomarkers have excellent specificity and sensitivity [10]. Among all kinds of biomarkers, the increase of cardiac troponin I (cTnI) which is regarded as “gold standard” shows high specificity towards cardiac injury [11,12], for cTnI is only expressed in myocardial cells and would be released into blood through ruptured cell membranes once these cells are damaged [13]. The concentration of cardiac troponin (cTn) starts to rise 2-4 h after the presence of myocardial ischaemia symptoms and reach the maximum in 24-48 h. The elevated condition could last 5-10 days. Various conditions which are also of vital significance could result in elevation of cTnI such as severe anemia, coronary spasm, myocarditis, heart failure, renal failure [7]. The elevation of cTnI is chronical when patients have severe chronic kidney disease (CKD) and is slower in the presence of impaired renal function [14]. Since it is the change in cTnI concentration that matters more and elevation is relatively slow [15], the concentration should be tested every 3-6 h in order to monitor any physical abnormity.
Currently, various methods are available for the detection of cTnI, such as chemiluminescence, fluorescence,electrochemical immunoassay and surface-enhanced Raman scattering (SERS)-based sandwich immunoassay platform [16-18]. However, chemiluminescence immunoassay requires complex operations, large expenses and time consumption, while fluorescence immunoassay is bulky, expensive and requires trained personnel to perform the tests. The electrochemical method cannot perform consecutive detection. SERS-based sandwich immunoassay platform was need nanoparticles for enhancement the signal and it belonged to indirect measurement, so that we designed surface plasmon resonance (SPR) biosensors to overcome these drawbacks. SPR biosensors as an optical detection technology, which measure changes in the refractive index of a material upon a metal surface, have been widely used in detecting and characterizing chemical and biological molecules [19]. This technique shows unparalleled advantages, such as label-free detection, real-time analysis of interaction and high sensitivity [19,20]. Also, it overcomes the defects of multiple preparation steps, low specificity and interference caused by additives [21]. In previous research, Yang, et al. utilized the amplification effect of surface-plasmon-enhanced light scattering of nanoparticles to achieve ultrasensitive biosensing of cTnI [22]. Guo, et al. described a rapid and sensitive method for detecting cTnI, which was based on the changes of longitudinal SPR wavelength of gold nanorods upon antibody-antigen binding [23]. However, applications in complex media should be taken into consideration since biofouling caused by nonspecific adsorption will seriously influence the reliability and accuracy of the biosensor in clinical sample analysis [24,25]. Therefore, a bifunctional biosensor with anti-fouling characteristics as well as high specific binding to cTnI is needed.
In this work, we designed a selective platform for cTnI concentration detection in further applications in MI diagnosis. In this system, zwitterionic peptides, which were partly biotinylated, were self-assembled onto gold substrate to resist nonspecific protein adsorption, and aptamers that specifically recognize cTnI were conjugated by a streptavidin-biotin binding system. This biosensing system could immobilize more bioreceptors without impairment of the fouling resistance of the zwitterionic peptide layer, and it increases the selectivity and sensitivity of the biosensor, providing a sensitive and accurate method for the detection of cTnI in complex media. The level of cTnI in serum of normal patients ranges from 0.2 to 5 ng/ml, increasing to 20-550 ng/ml at 18 h after AMI [26]. Patients with concentrations in blood higher than 10 ng/ml and 100 ng/ml could be considered to have medium and large sized MI respectively [16]. Various symptoms including anxiety, chest discomfort and feeling of suffocation could appear in this range, while patients may not attach enough importance to discomforts, so that average delay between onset of AMI symptoms and patients’ seeking for medical assistance was 4.5 h [27]. The aptasensor designed in our research is equipped to present excellent detection ability in this important concentration range, assisting patients to be aware of physical abnormalities as soon as possible. Along with intermittent tests, aptasensor we designed could monitor cTnI levels and variations, so that average delay would be shortened and prognostic function for medium and high level MI would be achieved.
Characterization of the sensing interference
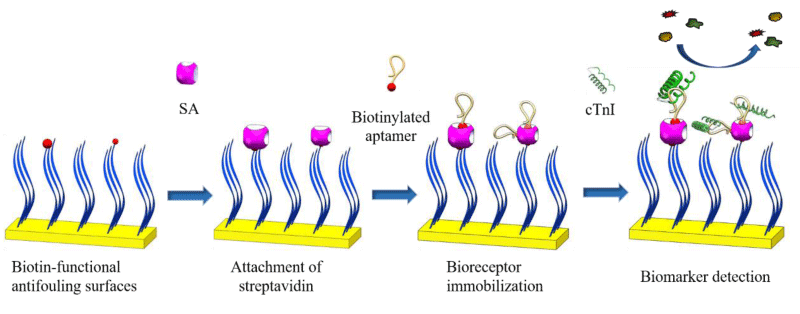
Scheme 1 shows the fabrication process of aptamer, streptavidin, peptide and biotinylated peptide on gold surface (Apt/SA/pep/Au). The pep/Au was used for SPR sensing experiments by first attaching SA, then immobilizing biotinylated aptamers on the surface. In this method, the chips were endowed with recognition function for specific binding with cTnI. The noncovalent binding between SA and biotin is one of the strongest interactions in nature, which provides a stable linkage between anti-fouling surface and bioreceptors. The isoelectric point of SA is 6.8-7.5, which can minimize nonspecific protein adsorption in complex media within this pH range. In addition to the high affinity, as a homotetramer, SA has four subunits that can bind with biotin, which can increase the immobilization of bioreceptors. These properties will make the biosensor capture targets from the complex media more selectively and sensitively.
Figure 1 shows the sensorgram of the immobilization of aptamer and the detection process of cTnI. PBS was initially flowed to determine the baseline, and 50 µg/ml SA solution was flowed to conjugate it with biotinylated peptides. After that step, the additional binding sites provided a platform for subsequently immobilizing biotinylated aptamers. Next, 1 µM aptamers were introduced, and the unconjugated aptamers were rinsed away with PBS. The adsorption of 1 ng of protein on the interface may cause an angle shift of 0.1° [28,29]. Our results indicated that the amount of SA on the surface was 1.744 ng mm-2 or 2.91×10⁻¹⁴ mol mm-2, and the amount of aptamer immobilized was 0.476 ng mm-2 or 3.81×10⁻¹⁴ mol mm-2
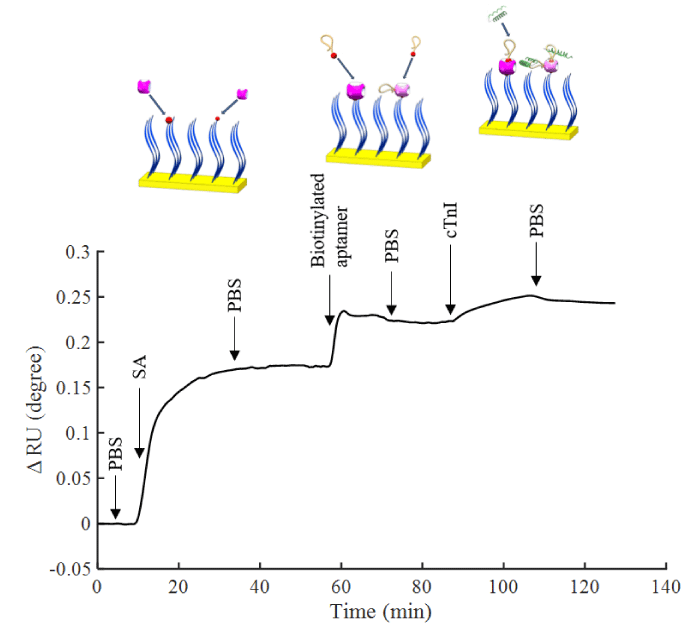
Figure 1: Sensorgram of surface attachment with SA, aptamer immobilization and detection of cTnI in situ measurement by SPR.
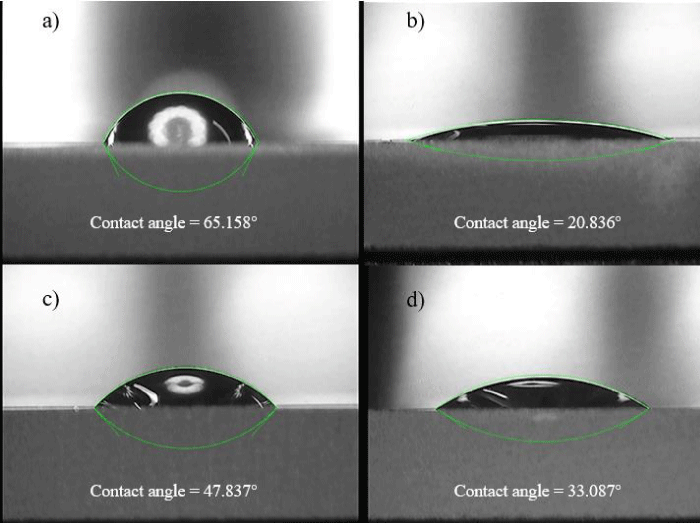
Figure 2: Contact angle measurement. a) Bare gold. b) pep/Au. c) SA/ pep/Au. d) Apt/ SA/pep/Au.
Sensitivity and reusability of the cTnI aptamer sensor: To assess the sensing performance of the aptamer sensor, five different concentrations cTnI solution from 20 ng/ml to 600 ng/ml were detected by SPR (Figure 3a). The results showed angle shifts of 0.0041°, 0.0057°, 0.0096°, 0.0151° and 0.0201°, respectively, when detecting the solutions concentrations of 20 ng/ml, 50 ng/ml, 200 ng/ml, 400 ng/ml and 600 ng/ml. As shown in figure 3b, the correlation between the concentrations of cTnI and the SPR angle shift fits the linear equation ΔRU = 2.778×10⁻⁵[C] + 0.004 with good linear correlation (R2 = 0.997), which suggested that the Apt/SA/pep/Au allowed for highly accurate detection and the limit of detection (LOD) calculated was 20 ng/ml.
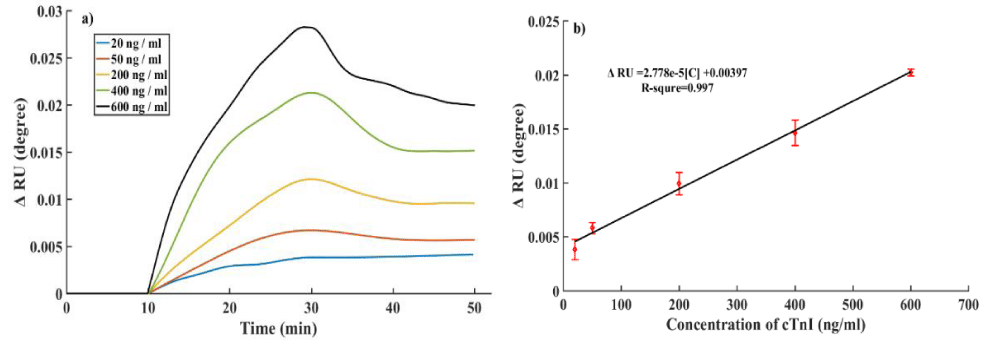
Figure 3: a) Aptasensor responses for different concentrations of cTnI from 20 ng/ml to 600 ng/ml. b) calibra-tion curve of aptasensor. Error bars represent the standard deviations of three repeated measurements.
Comparing the performance of aptasensor presented in this work with some previously reported biosensors for cTnI detection (Table 1), we found that the presented sensor exhibited a relatively low LOD. The sensitivity enhancement was ascribed to the multiple bioreceptors binding sites of SA/pep/Au, which increased the number of immobilized aptamers on the surface of the sensor chip. Limited by the refractive index resolution of our self-designed SPR biosensor, the detection limit in this work was not as good as the electrochemical assays. However, a secondary antibody with horseradish peroxidase-conjugated label molecule was required for indirect detection of cTnI, such as using electrochemical immunosensor proposed by Rezaei, et al. [32]. Compared with above method, the SPR aptasensor we designed reduces the effect came from labeling and the number of detection steps. Also, combined with an appropriate amplification strategy, the sensitivity of detection could be further improved [21].
| Table 1: Comparison of different cTnI detection methods. | |||
| Method | LOD | Antibody | Reference |
| Microfluidic networks-based micromosaic immunoassays | 50 µg ml-1 | Yes | [33] |
| Cationic isotachophoresis using cascade microchip | 46 ng ml-1 | Yes | [34] |
| Colorimetric aptasensor-based dot blot application | 5 ng ml-1 | No | [35] |
| Electrochemical immunosensor using multi-walled carbon nanotube-whiskered nanofibers | 0.04 ng ml-1 | Yes | [32] |
| HGNP-PDA-based sandwich-type SPR assay | 38 ng ml-1 | Yes | [21] |
| Peptide-based aptasensor SPR assay | 20 ng ml-1 | No | This work |
Another merit of the aptasensor was that aptamers could be repeatedly captured and eluted from the target. The binding between aptamer and target can be destroyed by massive injection of a solution with a large number of ions [36]. In this work, the aptasensor after binding with 600 ng/ml cTnI was rinsed by 1.5 M NaCl for 30 min to elute cTnI from the aptamer followed by fully washing with PBS for 30 min prior to the next binding process. As shown in figure 4, the aptasensor possessed approximately 90% of the initial analytical performance after four repeated measurements. The slight decrease in the aptasensor performance could be attribute to the incomplete removal of the target, as well as mixed SAM degradation. This reusability can minimize the cost of MI clinical diagnosis drastically.
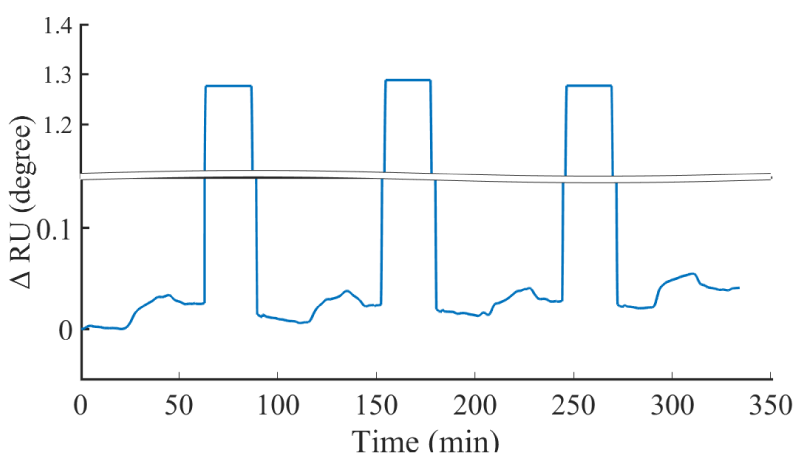
Figure 4: The sensorgram of prepared aptasensor reusability test for four rounds.
Kinetics parameter calculation
The affinity interactions between immobilized aptamer and antigen were characterized by the equilibrium constant KD. Generally, the KD should be low enough (10-5-10R-6 M) to form a stable complex, and if KD ≤ 10 nM confirms the interactions of receptor with the ligand as high affinity one [37]. The adsorption curve was analyzed to obtain values for the maximum SPR signal, ∆θSPRmax. The formation of aptamer-cTnI complex can be described [37] by
Excited ∆θSPRmax of different concentrations are obtained through adsorption curve (eq.8) fitting. The relationship between ∆θSPRmax/L0 and L0 is plotted as shown in figure 5. The linear regression equation was obtained as [C]/ΔθSPRmax = 2.4562*[C] +1.6577×10⁻⁷. Thus, the equilibrium association constant KD is 6.75 nM. The calculated KD value presented here was lower than the antibody against cTnI, suggesting that the aptamer sensor shows a high affinity interaction with the cTnI, which could serve as a substitutional method for the cTnI antibody for sensitive diagnosis of MI.
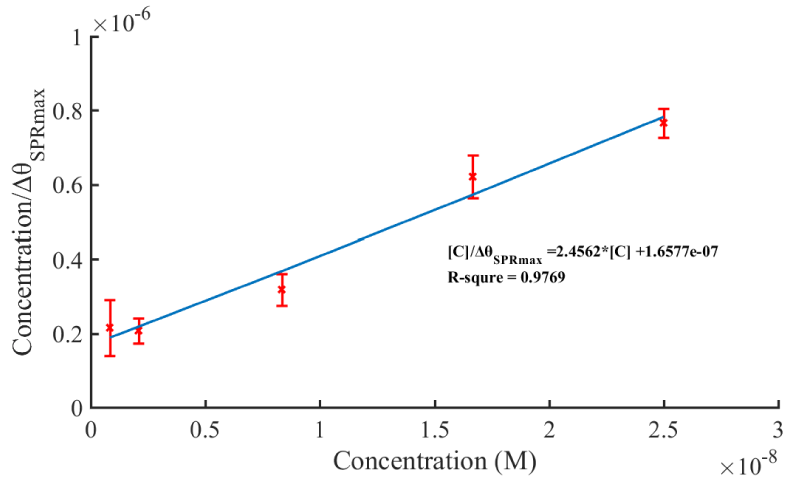
Figure 5: The value of concentration divided by maximum SPR signal versus concentration of cTnI.
Antifouling ability
SPR is a powerful analytical tool suitable for interfacial investigation. The SPR response is directional and sensitive to the interactions between biomolecules, as well as to nonspecific protein adsorption. To evaluate the antifouling ability of the peptide-based aptasensor, 1 mg/ml HSA, 1 mg/ml BSA and 2 µg/ml Lys single-protein solutions were used to assay nonspecific adsorption because those proteins contain hydrophobic, hydrophilic, and charged regions and can adhere to surfaces by hydrogen-bonding, electrostatic, charge-transfer, and/or hydrophobic interactions [38]. In addition, the proteins are normally in serum, and their concentrations are much higher than cTnI. As shown in figure 6, the resonance angle shifts of HSA, BSA, and Lys in nonspecific adsorption tests were 2.1×10⁻⁴, 2.0×10⁻⁴ and 1.8×10⁻⁴ degrees, respectively, while the amount of nonspecific adsorption proteins was much lower than that of binding with 50 ng/ml cTnI, at approximately 0.057 ng/mm2. According to these results, the peptide-based aptasensor shows an outstanding anti-fouling ability towards interfering proteins.
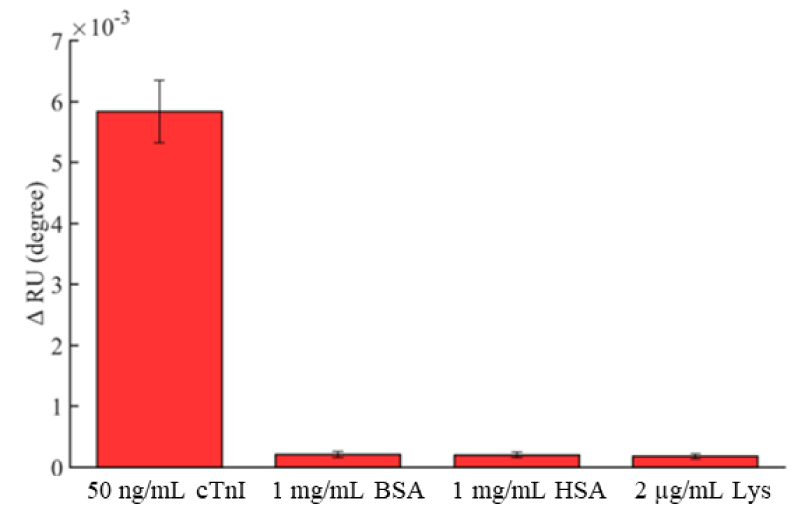
Figure 6: Shifts of the resonant angle measured with different proteins (cTnI, BSA, Lys and HSA). Error bar = ± S. D. and n = 3.
Detection in complex media
Selectivity and specificity are pivotal factors for biomarker analysis because nonspecific adsorption may severely influence the accuracy of detection results. To investigate the clinical applicability of the present aptasensor, the quantification analysis of different concentrations of cTnI in 10% FBS was carried out. Figure 7 shows the calibration curve from 50 ng/ml to 600 ng/ml of cTnI and the SPR signal shift. Figure 7 showed that it still had a slight interference in 10% FBS, but it also had the linear relationship which the liner regression equation obtained was ΔRU = 6.287×10⁻⁵ [C] + 0.1075 with a square of correlation coefficients of over 0.98. In our SPR system, the background noise is about 0.0003°. Based on signal: noise ratio ≥ 3 criterion, calculating the LOD could be reached 20 ng/mL. This result suggests that the peptide-based aptasensor shows high selectivity and specificity for detecting cTnI in complex media. Above all, the aptasensor presented in this instance is selective, accurate and stable which has potential practical applications in medium sized MI clinical diagnosis.
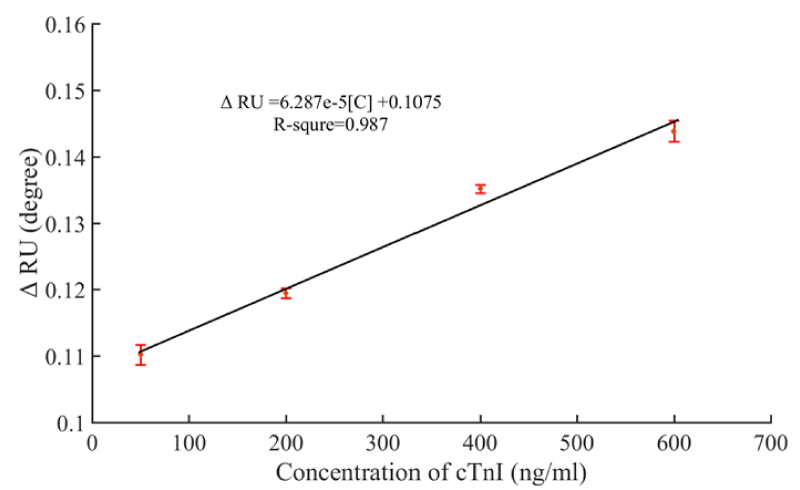
Figure 7: Fitted calibration curve of resonant angle shifts obtained from prepared aptasensor for detection of cTnI in 10% FBS.
In this study, a peptide-based aptasensor was prepared through zwitterionic peptides self-assembling onto gold chips which provides an antifouling layer, and by using the biotinylated peptides to immobilize SA and then biotinylated aptamers specific to cTnI. This method can enhance the immobilization of bioreceptors without impairing the antifouling property of peptide monolayers. These combinations of properties endow the aptasensor with good sensitivity for cTnI detection with a limit of 20 ng/ml in SPR measurement, along with high antifouling ability against protein and excellent selectivity towards cTnI in a complex medium, enabling the prognoses for medium and large sized MI or any other worrying physical abnormalities. Our study provides a universal strategy for detection of other relevant or low-abundance biomarkers to accurately determine their concentrations in complex matrices. Further researches should be conducted on the perfection of this promising aptasensor for more widespread applications.
Materials and reagents
Natural cardiac troponin I protein was purchased from Abcam (Cambridge, UK). Human serum albumin (HSA), bovine serum albumin (BSA) and lysozyme (Lys), streptavidin (SA) and 0.01 M, pH 7.2-7.4 phosphate buffer solution (PBS) were purchased from Solarbio (Beijing, China). Fetal bovine serum (FBS) was purchased from HyCloneTM (Logan, UT, USA). MgCl2 was purchased from Macklin Biochemical Co. Ltd. (Shanghai, China). The cTnI-binding aptamers terminated with a biotin group, 5’-biotin-CGTGCAGTACGCCAACCTTTCTCATGCGCTGCCCCTCTTA-3’ [39], the zwitterionic peptides (sequence: EKEKEKE-PPPPC, purity > 95%) and the zwitterionic peptides with a terminal biotin (sequence: N’-biotin-EKEKEKE-PPPPC, purity > 95%) were synthesized by Sangon Biotech Co., Ltd. (Shanghai, China). Absolute ethyl alcohol and sodium chloride (NaCl) were purchased from Beijing Chemical Works (Beijing, China). Deionized water (18 MΩ·cm) obtained from a CCT-3300 water purification system was used in all the experiments.
Instrumentation
The water contact angle tests were carried out with a Tianmin contact angle meter to determine the hydrophilicity of various chip surfaces. The biosensor chip was mounted on the plane of the angle meter, and four microliters of deionized water was dropped onto the chip surface. The droplet cross-section image was recorded by the software supplied by the manufacturer. The open-source software ImageJ was used to estimate the contact angle from cross-sectional images.
The angle-scanning surface plasmon resonance biosensor used in this work was self-designed to detect the interactions between biomolecules on the chip surface [38,40]. The equipment applied the Kretschmann configuration to achieve attenuated total reflection combined with a liquid flow analysis system. The refractive index matching oil was used in optical coupling between Au-coated glass slides and prisms. A 650-nm laser wave was P-polarized by a polarizer and projected onto the Au-prism interface via a triangular prism. All the SPR measurements were conducted at the temperature of 25 (± 0.05) °C.
Preparation of the biosensor chips
Preparation of the biotin-functional antifouling surfaces: The bare gold chip was first immersed in absolute ethanol for 3 mins, then extensively rinsed by ultrapure water followed by absolute ethanol and dried with nitrogen flow. Afterwards, the chip was clean by UV-ozone for 30 min. To construct a biotin-functional antifouling layer, the clean gold chip was incubated in 0.01 M PBS containing 0.1 mg/ml peptides and 0.0101 mg/ml biotinylated peptides for 12 h at 37 °C. During this process, peptides self-assembled onto the gold surface by the amino acid cysteine (C), which contains a thiol side chain that can grab the peptide to attach it to the gold chip (pep/Au) [41]. The obtained pep/Au was thoroughly rinsed with PBS and ultrapure water and blow-dried with nitrogen. The biotin-functional antifouling surfaces were prepared as controls [42].
Attachment of streptavidin and aptamer immobilization: The streptavidins were attached onto biotin-functional surfaces by immersing the pep/Au in 50 µg/ml SA solution (0.01 M PBS) for 2 h at 37 °C, and the unconjugated SA was washed by PBS and ultrapure water. The obtained SA attachment chips (SA/pep/Au) were then blow-dried with nitrogen. The cTnI aptamers were immobilized on the SA/pep/Au through the streptavidin-biotin system (Apt/SA/pep/Au). The modified chips were then immersed in 1.0 µM aptamer solution (0.01 M PBS) for 2 h at 37 °C. Finally, the peptide-based aptamer sensors were thoroughly rinsed with PBS and stored in PBS at 4 °C before use.
Surface plasmon resonance (SPR) measurements
Aptasensor fabrication process and cTnI detection: In all SPR measurements, the temperature was controlled at 25°C, and the sample was injected at the flow rate of 25 µl/min.
To observe the attachment of streptavidin and aptamer immobilization, the pep/Au was placed in the SPR sensor, and then SA and biotinylated aptamer were immobilized in situ. Before measurements, PBS was injected onto the chip until a 10 min steady baseline was obtained. Then, 50 µg/ml SA solution was injected for 30 min, and subsequently, PBS was flowed over it for 20 min. To immobilize aptamers, a solution of 1.0 µM aptamer was injected for 30 min, followed by a PBS wash for 20 min. The analyte was detected by injecting different concentrations of cTnI in PBS or 10% FBS for 20 min, then washing away unbound cTnI with PBS for 20 min (Scheme 1).
Scheme 1: Fitted calibration curve of resonant angle shifts obtained from prepared aptasensor for detection of cTnI in 10% FBS.
Antifouling and reusability tests
Solutions of 1mg/ml HSA, 1 mg/ml BSA and 1.7 µg/ml Lys were introduced to evaluate the anti-fouling ability of the peptide-based aptasensor. Each single-protein solution was flowed through the aptasensor for 20 min followed by rinsing with PBS, and changes in the sensorgram were recorded. Aptasensor regeneration was achieved by incubating the chips in 1.5 M NaCl solution for 30 min. The SPR signal was collected in real time until the sensorgram remained constant. The aptasensor was then rinsed with PBS for 10 min to establish a new baseline.
Kinetic parameters
The affinity interactions between immobilized aptamer and cTnI were characterized by the association rate constant ka, dissociation rate constant kd and equilibrium association constant kd(kd = kd/ka). All the adsorption and desorption measurements reported in this paper were fitted using a simple 1:1 interaction model i,e., A + B ↔ AB. The initial concentrations of receptor and ligand were assumed as R0 and L0. After the start of affinity interactions, the receptor, ligand and complex concentrations were R, L and C, respectively, while the rate of complex increase can be described by
In the flow cell of SPR sensor the L0 >> R0, thus the change of ligand’s concentration was generally ignored, then L0-c≈ L0. Under these conditions equation 1 can be simplified as
The relationship of complex’s concentration and t can be obtained by solving the equation 2.
In the SPR measurements the shift of resonance angle is proportional to the change of surface density. We supposed there was a thickness lR receptor which has already been immobilized on the SPR sensor chips, resulting a ∆θR resonance angle shift. The affinity interaction between receptor and ligand causes a thickness lL of ligand covered on the receptor layer. For the interactions of receptor-ligand system in SPR measurements we have
where ∆θSPR is the SPR response of complex. Combining equation 3 and equation 4, we can obtain
After a sufficiently long time, a dynamic equilibrium state is achieved and a maximum SPR signal ∆θSPRmax can be obtained as
Performing a transform on equation 6, we have
A series of concentrations of solution L0 was used to derive the relationship between ∆θSPRmax/L0 and L0, and a regression curve was obtained from equation 7. Thus, the equilibrium association constant KD is the ratio of intercept and slope.
This work was supported by the UCAS Young teacher research fund (Y95401H), by the Beijing Natural Science Foundation (Z160002), and by the Chinese Academy of Sciences Key project foundation (KFZD-SW-202).
- World Health Organization. Global status report on noncommunicable diseases 2014 [R]. World Health Organization, 2014.
- Agewall S, Giannitsis E, Jernberg T, Katus H. Troponin elevation in coronary vs. non-coronary disease. Eur Heart J. 2010; 32: 404-411. PubMed: https://www.ncbi.nlm.nih.gov/pubmed/21169615
- Wang J, Wang X, Ren L, Wang Q, Li L, et al. Conjugation of biomolecules with magnetic protein microspheres for the assay of early biomarkers associated with acute myocardial infarction. Anal Chem. 2009; 81: 6210R-6217. PubMed: https://www.ncbi.nlm.nih.gov/pubmed/19555077
- Bottenus D, Jubery T Z, Ouyang Y, Dong WJ, Dutta P, et al. 10000-fold concentration increase of the biomarker cardiac troponin I in a reducing union microfluidic chip using cationic isotachophoresis. Lab Chip. 2011; 11: 890-898. PubMed: https://www.ncbi.nlm.nih.gov/pubmed/21416810
- Leisy PJ, Coeytaux RR, Wagner GS, Chung EH, McBroom AJ, et al. ECG-based signal analysis technologies for evaluating patients with acute coronary syndrome: A systematic review. J Electrocardiol. 2013; 46: 92-97. PubMed: https://www.ncbi.nlm.nih.gov/pubmed/23273746
- Thygesen K, Alpert JS, Jaffe AS, et al. Fourth universal definition of myocardial infarction (2018). J American College of Cardiology. 2018; 72: 2231-2264.
- Bax J J, Baumgartner H, Ceconi C, Simoons ML, Chaitman BR, et al. Third universal definition of myocardial infarction. J Am Coll Cardiol. 2012; 60: 1581-1598. PubMed: https://www.ncbi.nlm.nih.gov/pubmed/22958960
- Collinson PO, Heung YM, Gaze D, Boa F, Senior R, et al. Influence of population selection on the 99th percentile reference value for cardiac troponin assays. Clin Chem. 2012; 58: 219-225. PubMed: https://www.ncbi.nlm.nih.gov/pubmed/22100808
- Thygesen K, Mair J, Giannitsis E, Mueller C, Lindahl B, et al. How to use high-sensitivity cardiac troponins in acute cardiac care. Eur Heart J. 2012; 33: 2252-2257. PubMed: https://www.ncbi.nlm.nih.gov/pubmed/22723599
- Jaffe A S, Ordonez-Llanos J. High sensitivity troponin in chest pain and acute coronary syndromes. A step forward?. Rev Esp Cardiol. 2010; 63: 763-769. PubMed: https://www.ncbi.nlm.nih.gov/pubmed/20609309
- Bodor GS, Porter S, Landt Y, Ladenson JH. Development of monoclonal antibodies for an assay of cardiac troponin-I and preliminary results in suspected cases of myocardial infarction. Clin Chem. 1992; 38: 2203-2214. PubMed: https://www.ncbi.nlm.nih.gov/pubmed/1424112
- Adams 3rd J E, Bodor GS, Davila-Roman VG, Delmez JA, Apple FS, et al. Cardiac troponin I. A marker with high specificity for cardiac injury. Circulation. 1993; 88: 101-106. PubMed: https://www.ncbi.nlm.nih.gov/pubmed/8319322
- Bahadır EB, Sezgintürk MK. Applications of electrochemical immunosensors for early clinical diagnostics. Talanta. 2015; 132: 162-174. PubMed: https://www.ncbi.nlm.nih.gov/pubmed/25476294
- Mann D L, Zipes D P, Libby P, et al. Braunwald's heart disease e-book: a textbook of cardiovascular medicine. Elsevier Health Sciences. 2014
- Reichlin T, Irfan A, Twerenbold R, Reiter M, Hochholzer W, et al. Utility of absolute and relative changes in cardiac troponin concentrations in the early diagnosis of acute myocardial infarction. Circulation. 2011; 124: 136-145. PubMed: https://www.ncbi.nlm.nih.gov/pubmed/21709058
- Fathil MFM, Arshad MKM, Gopinath SCB, Hashim U, Adzhri R, et al. Diagnostics on acute myocardial infarction: Cardiac troponin biomarkers. Biosens Bioelectron. 2015; 70: 209-220. PubMed: https://www.ncbi.nlm.nih.gov/pubmed/25841117
- Qureshi A, Gurbuz Y, Niazi J H. Biosensors for cardiac biomarkers detection: A review. Sensors and Actuators B: Chemical. 2012; 171: 62-76.
- Cheng Z, Wang R, Xing YI, Zhao L , Choo J, et al. SERS-based immunoassay using gold-patterned array chips for rapid and sensitive detection of dual cardiac biomarkers. Analyst. 2019; 144: 6533-6540. PubMed: https://www.ncbi.nlm.nih.gov/pubmed/31553332
- Dutra RF, Mendes RK, da Silva VL, Kubota LT. Surface plasmon resonance immunosensor for human cardiac troponin T based on self-assembled monolayer. J Pharm Biomed Anal. 2007; 43: 1744-1750. PubMed: https://www.ncbi.nlm.nih.gov/pubmed/17254730
- Oh BK, Kim YK, Lee W, Bae YM, Lee WH, et al. Immunosensor for detection of Legionella pneumophila using surface plasmon resonance. Biosens Bioelectron. 2003; 18: 605-611. PubMed: https://www.ncbi.nlm.nih.gov/pubmed/12706569
- Wu Q, Li S, Sun Y, et al. Hollow gold nanoparticle-enhanced SPR based sandwich immunoassay for human cardiac troponin I. Microchimica Acta. 2017; 184: 2395-2402.
- Yang CT, Wu L, Liu X, Tran NT, Bai P, et al. Exploiting surface-plasmon-enhanced light scattering for the design of ultrasensitive biosensing modality. Anal Chem. 2016; 88: 11924-11930. PubMed: https://www.ncbi.nlm.nih.gov/pubmed/27934101
- Guo Z, Gu C, Fan X, Bian Z, Wu H, et al. Fabrication of anti-human cardiac troponin I immunogold nanorods for sensing acute myocardial damage. Nanoscale Res Lett. 2009; 4: 1428-1433. PubMed: https://www.ncbi.nlm.nih.gov/pubmed/20652133
- Sun C, Han Q, Wang D, Xu W, Wang W, et al. A label-free and high sensitive aptamer biosensor based on hyperbranched polyester microspheres for thrombin detection. Anal Chim Acta. 2014; 850: 33-40. PubMed: https://www.ncbi.nlm.nih.gov/pubmed/25441157
- Dhawan S, Sadanandan S, Haridas V, Voelcker NH, Prieto-Simón B. Novel peptidylated surfaces for interference-free electrochemical detection of cardiac troponin I. Biosens Bioelectron. 2018; 99: 486-492. PubMed: https://www.ncbi.nlm.nih.gov/pubmed/28823973
- Ko S, Kim B, Jo SS, Oh SY, Park JK. Electrochemical detection of cardiac troponin I using a microchip with the surface-functionalized poly (dimethylsiloxane) channel. Biosens Bioelectron. 2007; 23: 51-59. PubMed: https://www.ncbi.nlm.nih.gov/pubmed/17462876
- Doehrman SR. Psycho-social aspects of recovery from coronary heart disease: a review. Soc Sci Med. 1977; 11: 199-218.
- Gesellchen F, Zimmermann B, Herberg FW. Direct optical detection of protein-ligand interactions. Methods Mol Biol. 2005; 305: 17-45.
- Hwang SY, Yoon CH, Jeon JY, et al. Quantitative assay of hepatitis B surface antigen by using surface plasmon resonance biosensor. Biotechnology and Bioprocess Engineering. 2005; 10: 309.
- Mir M, Cameron PJ, Zhong X, Azzaroni O, Alvarez M, et al. Anti-fouling characteristics of surface-confined oligonucleotide strands bioconjugated on streptavidin platforms in the presence of nanomaterials. Talanta. 2009; 78: 1102-1106. PubMed: https://www.ncbi.nlm.nih.gov/pubmed/19269478
- Wang Y, Cui M, Jiao M, Luo X. Antifouling and ultrasensitive biosensing interface based on self-assembled peptide and aptamer on macroporous gold for electrochemical detection of immunoglobulin E in serum. Anal Bioanal Chem. 2018; 410: 5871-5878. PubMed: https://www.ncbi.nlm.nih.gov/pubmed/29938372
- Wolf M, Juncker D, Michel B, Hunziker P, Delamarche E. Simultaneous detection of C-reactive protein and other cardiac markers in human plasma using micromosaic immunoassays and self-regulating microfluidic networks. Biosens Bioelectron. 2004; 19: 1193-1202. PubMed: https://www.ncbi.nlm.nih.gov/pubmed/15046750
- Bottenus D, Hossan MR, Ouyang Y, Dong WJ, Dutta P, et al. Preconcentration and detection of the phosphorylated forms of cardiac troponin I in a cascade microchip by cationic isotachophoresis. Lab Chip. 2011; 11: 3793-3801. PubMed: https://www.ncbi.nlm.nih.gov/pubmed/21935555
- Dorraj GS, Rassaee MJ, Latifi AM, Pishgoo B, Tavallaei M. Selection of DNA aptamers against Human Cardiac Troponin I for colorimetric sensor based dot blot application. J Biotechnol. 2015; 208: 80-86. PubMed: https://www.ncbi.nlm.nih.gov/pubmed/26003883
- Negahdary M, Behjati-Ardakani M, Sattarahmady N, et al. Electrochemical aptasensing of human cardiac troponin I based on an array of gold nanodumbbells-Applied to early detection of myocardial infarction. Sensors and Actuators B: Chemical. 2017; 252: 62-71.
- Ahirwar R, Nahar P. Development of an aptamer-affinity chromatography for efficient single step purification of Concanavalin A from Canavalia ensiformis. J Chromatogr B. 2015; 997: 105-109. PubMed: https://www.ncbi.nlm.nih.gov/pubmed/26102634
- Wegner GJ, Wark AW, Lee HJ, Codner E, Saeki T, et al. Real-time surface plasmon resonance imaging measurements for the multiplexed determination of protein adsorption/desorption kinetics and surface enzymatic reactions on peptide microarrays. Anal Chem. 2004; 76: 5677-5684. PubMed: https://www.ncbi.nlm.nih.gov/pubmed/15456285
- Zhang CG, Chang S J, Settu K, et al. High-sensitivity glycated hemoglobin (HbA1c) aptasensor in rapid-prototyping surface plasmon resonance[J]. Sensors and Actuators B: Chemical. 2019; 279: 267-273.
- Jo H, Gu H, Jeon W, Youn H, Her J, et al. Electrochemical aptasensor of cardiac troponin I for the early diagnosis of acute myocardial infarction. Anal Chem. 2015; 87: 9869-9875. PubMed: https://www.ncbi.nlm.nih.gov/pubmed/26352249
- Zhang CG, Chen CJ, Settu K, et al. Angle-Scanning Surface Plasmon Resonance System with 3D Printed Components for Biorecognition Investigation. Advances in Condensed Matter Physics. 2018; 2018.
- Nowinski AK, Sun F, White AD, Keefe AJ, Jiang S. Sequence, structure, and function of peptide self-assembled monolayers. J Am Chem Soc. 2012; 134: 6000-6005. PubMed: https://www.ncbi.nlm.nih.gov/pubmed/22401132
- Anker JN, Hall WP, Lyandres O, et al. Biosensing with plasmonic nanosensors[M]//Nanoscience and Technology: A Collection of Reviews from Nature Journals. 2010; 308-319.