
More Information
Submitted: March 08, 2021 | Approved: March 16, 2021 | Published: March 17, 2021
How to cite this article: Kim G, Yoon KW, Park C, Kang KH, Kim S, et al. Fecal storage condition induces variations of microbial composition and differential interpretation of metagenomic analysis. Ann Biomed Sci Eng. 2021; 5: 006-012.
DOI: 10.29328/journal.abse.1001011
ORCiD: orcid.org/0000-0003-1027-8850
Copyright License: © 2021 Kim G, et al. This is an open access article distributed under the Creative Commons Attribution License, which permits unrestricted use, distribution, and reproduction in any medium, provided the original work is properly cited.
Keywords: Fecal storage; Metagenomic analysis; Variation; Microbial composition; Population studies

Fecal storage condition induces variations of microbial composition and differential interpretation of metagenomic analysis
Gihyeon Kim1†, Kyoung Wan Yoon2,3†, Changho Park2†, Kyu Hyuck Kang2, Sujeong Kim1, Youngmin Yoon1, Sang Eun Lee1, Yeongmin Kim1 and Hansoo Park1,2*
1Department of Biomedical Science and Engineering, Gwangju Institute of Science and Technology (GIST), Gwangju, Korea
2Genome and Company, Pangyo-ro 253, Bundang-gu. Seoungnam-si, Gyeonggi-do 13486, Korea
3Department of Biotechnology, Hoseo University, Asan, 31499, Korea
*Address for Correspondence: Hansoo Park, Department of Biomedical Science and Engineering, Gwangju Institute of Science and Technology (GIST), Gwangju, Korea, Tel: 82-62-715-5415; Email: [email protected]
Advances in metagenomics have facilitated population studies of associations between microbial compositions and host properties, but strategies to minimize biases in these population analyses are needed. However, the effects of storage conditions, including freezing and preservation buffer, on microbial populations in fecal samples have not been studied sufficiently. In this study, we investigated metagenomic differences between fecal samples stored in different conditions. We collected 46 fecal samples from patients with lung cancer. DNA quality and microbial composition within different storage Methods were compared throughout 16S rRNA sequencing and post analysis. DNA quality and sequencing results for two storage conditions (freezing and preservation in buffer) did not differ significantly, whereas microbial information was better preserved in buffer than by freezing. In a metagenomic analysis, we observed that the microbial compositional distance was small within the same storage condition. Taxonomic annotation revealed that many microbes differed in abundance between frozen and buffer-preserved feces. In particular, the abundances of Firmicutes and Bacteroidetes varied depending on storage conditions. Microbes belonging to these phyla differed, resulting in biases in population metagenomic analysis. We suggest that a unified storage Methods is requisite for accurate population metagenomic studies.
Associations of gut microbes with human health are gradually becoming clear. There is compelling evidence for effects of gut microbes on various biological processes, including metabolism, brain function, digestion, nutrient storage, and immunity [1]. To analyze microbial function efficiently and accuracy, next-generation sequencing tools for metagenomic analyses have been developed [2]. Population metagenomic studies are important in terms of validation and minimizing selecting bias. Many population metagenomic studies have revealed associations between the microbial composition and host properties in the context of medicines, location, metabolic features, and disease [3-5]. However, unexpected bias can occur when ununified tools, experimental kits, and storage conditions are used.
Fecal storage is an important step for credible and accurate metagenomic analyses because microbes and their DNA/RNA are sensitive to the external environment, including oxygen and temperature [6-10]. Sequencing of the 16S rRNA region is a common Methods for investigating the gut microbial composition by mapping to reference sequences [3,11]. Unstable storage of fecal samples can damage microbial information (DNA and RNA) and induce errors in sequence data and metagenomic analyses [12]. To prevent these alterations and to ensure the accuracy of metagenomic analyses, feces should be preserved intact [13,14]. Storage at -80 °C or in liquid nitrogen is a common Methods for preventing degradation and changes in the microbial composition [15,16]. Fecal samples are often obtained from many sites, and researchers may have issues with storage at extremely low temperatures. Various tools, such as DNA/RNA shields, have been developed to maintain the original condition of feces [15,17,18]. However, the effects of different fecal storage conditions on the same microbial population are unclear.
In this study, we investigated differences in metagenomic results for feces obtained from the same population stored under different conditions. We compared fecal samples stored at -20 °C followed by -80 °C and those stored in preservation buffer (DNA/RNA Shield) at 4 °C. We analyzed the quality of extracted DNA, sequencing results, diversity, and taxonomic distributions to determine the effects of fecal storage conditions. We found that different storage Methodss gave rise to different microbial compositions, despite obtaining feces from the same population. Thus, we suggest that researchers use a single storage Methods for consistent and accurate results of metagenomic analyses.
Fecal sample collection, storage conditions, and DNA extraction
Fresh feces were collected from 46 patients with lung cancer. Twenty-two fecal samples were immediately stored at -20 °C and transported to a deep freezer at -80 °C until use. Twenty-four fecal samples were immediately stored in preservation buffer (Zymo, Irvine, CA, USA) at 4 °C for 1 year until use. DNA extraction was performed using 500 mg of feces per sample using the FastDNA® SPIN Kit for Soil (MP Biomedicals, Solon, CA, USA) & PowerFecal DNA Isolation Kit (MO BIO, Hilden, Germany) according to the manufacturer’s recommendations. DNA purity and quantity were estimated using a NanoDrop One Spectrophotometer (Thermo Scientific, Waltham, MA, USA).
Metagenomic 16S rRNA sequencing data analysis
The quality of raw sequence reads was analyzed using FastQC [19]. Illumina adapter sequences of paired-end reads were removed using cutadapt version 2.2 [20]. Then, trimmed sequences were processed using QIIME2 version 2019.4 [21]. Briefly, reads were assigned to each sample according to the unique index; pairs of reads from the original DNA fragments were merged using an import tool in QIIME2. To remove chimeras from the fastq files, the consensus method implemented in DADA2 was used. Alpha diversity was evaluated using the q2-diversity plugin in QIIME2 by rarefaction. Statistical analyses of alpha diversity indices were performed using non-parametric tests. Taxonomic annotation was performed by mapping to the training reference set with primers (forward, 5′-CCTACGGGNGGCWGCAG-3′; reverse, 5′-GACTACHVGGGTATCTAATCC-3′) for extracting the V3–V4 region using GreenGenes version 13_8 [21]. Linear discriminant effect size analysis (LEfSe) [22] was performed to identify differential features at the species level between groups base on linear discriminant analysis (LDA) scores. Statistical plots and calculations were generated using R and R studio [23] with the ggplot2 package [24].
To demonstrate the association between fecal storage conditions and population structure inferred from metagenomic analyses, 46 fecal samples were collected from one population of patients with lung cancer (Table S1). 22 fecal samples were stored at -20 °C for more than 12 months and then transported to -80 °C (frozen feces). The other 24 fecal samples were stored in preservation buffer (buffer-preserved feces). These 46 fecal samples were then lysed for DNA extraction and sequenced for analysis (Figure 1). Here, we analyzed the frozen feces for long duration at -20 °C and buffer-preserved feces mainly.
| Supplementary Table 1 | ||||
| Characteristics | Type | Frozen | Shield | p - value |
| Sex | Male | 16 | 20 | 0.484 |
| Female | 6 | 4 | ||
| Age | Mean (SD) | 67.32 (10.61) | 65.83 (12.22) | 0.662 |
| Histology | Adenocarcinoma | 17 | 17 | 0.497 |
| Squamous | 4 | 7 | ||
| Pleomorphic | 1 | 0 | ||
| Smoking | Current | 8 | 9 | 0.406 |
| EX | 8 | 12 | ||
| Non | 6 | 3 | ||
| Drug-target | PD-1 | 17 | 20 | 0.718 |
| PD-L1 | 5 | 4 | ||
| Summary of clinical characteristics of lung cancer patients whose feces were split into frozen and buffer storages. Significance of categorical characteristics was calculated by Fisher’s exact test. Significance of age was calculated by Wilcoxon-Mann-Whitney U test. EX is who used to smoking, not for nowadays. SD: Standard Deviation, PD-1: Programmed death-1, PD-L1: Programmed Death-Ligand 1. | ||||
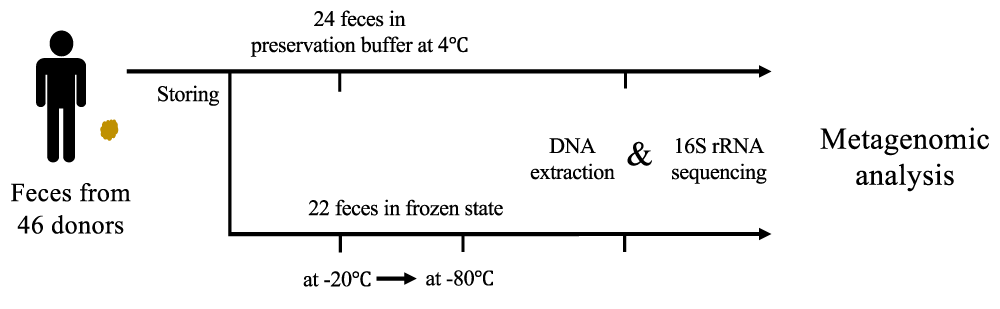
Figure 1: Schematic diagram of the study for design comparisons among fecal storage methods. In total, 46 fecal samples were collected from patients with lung cancer. The 24 fecal samples were stored in preservation buffer at 4 °C, 22 fecal samples were stored at -20 °C longer than 12 months and transported to -80 °C. All feces were used to obtain microbial DNA and then sequenced for metagenomic analyses.
Quality comparison of frozen and buffer-preserved fecal samples at the DNA level
We compared the amount of extracted DNA from each stored fecal sample to determine the effects of different storage conditions. The concentration of DNA from buffer-preserved feces was significantly higher than that from frozen feces (p < 0.005, Figure 2A). We also confirm that there was no bias caused by impurities affecting the measurement of concentrations (Figure 2B). Despite different concentrations of extracted DNA, the V3–V4 region was successfully amplified by polymerase chain reaction (PCR). To prevent bias from the sequencing procedure, we obtained sequence read counts and verified that there was no difference in counts between frozen and buffer-preserved fecal samples (Figure 2C). We trimmed adaptors, joined reads, and excluded chimeras and low quality-reads. The paired read count was higher for buffer-preserved feces than for frozen feces, indicating that microbial DNA was intact when stored in preservation buffer (p < 0.05, Figure 2D).
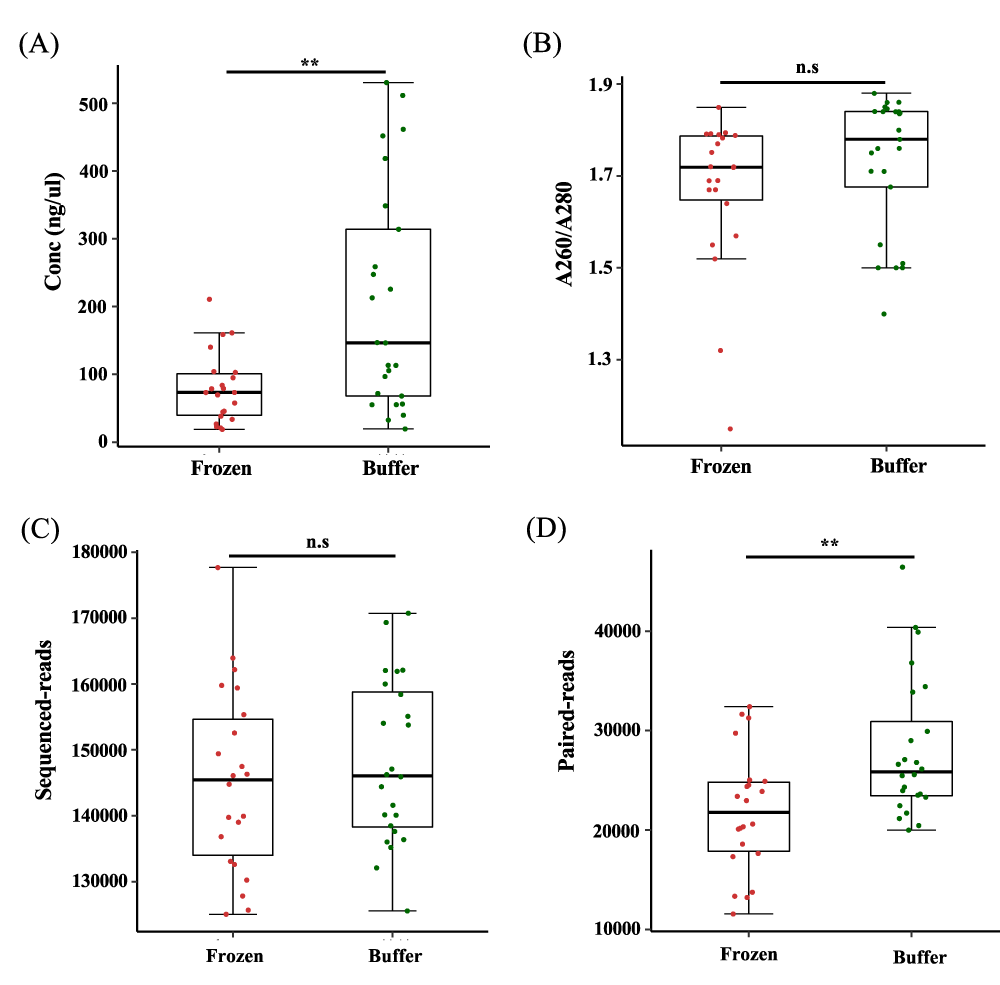
Figure 2: Numbers of sequence reads and paired-end reads from feces stored in different conditions. (a) Concentration (Conc) of DNA from fecal samples stored frozen and in preservation buffer (n = 22 and n = 24, respectively). (b) Ratio of absorbance at 260 to 280 as an indicated of purity. (c) Number of sequence reads for the V3–V4 region obtained by Illumina 16S rRNA sequencing. (d) Number of paired-end reads from feces. n.s.: non-significant; **p < 0.005. Significance was evaluated by the Wilcoxon-Mann-Whitney U test. Whiskers error bars represent the distribution of relative abundance.
Microbial diversity based on microbial composition distances of feces stored under different conditions
To investigate whether microbial states differed depending on storage conditions, we compared microbial diversity in frozen and buffer-preserved feces. We evaluated alpha diversity and observed that individual variation was greater than variation between frozen and buffer-preserved feces. In particular, species counts were significantly higher in buffer-preserved feces than in frozen feces, but other alpha diversity indexes did not exhibit significant differences (Figure 3 A-C). However, beta diversity showed scattered individuals dependent on the storage method (Figure 3 D, p = 0.001). We found that the phylogenetic distance (sequence distance) weighted by microbial abundance also split individuals into two groups (Figure 3D). Here, we discovered that frozen feces were coordinated with Firmicutes mainly when Bacteroidetes coordinated buffer-preserved feces. These microbial characteristic variations might be also affected by durations at -20 °C before transferred at -80 °C (Figure 3D). These results suggested that the different storage conditions induced variation in the microbial composition of a population.
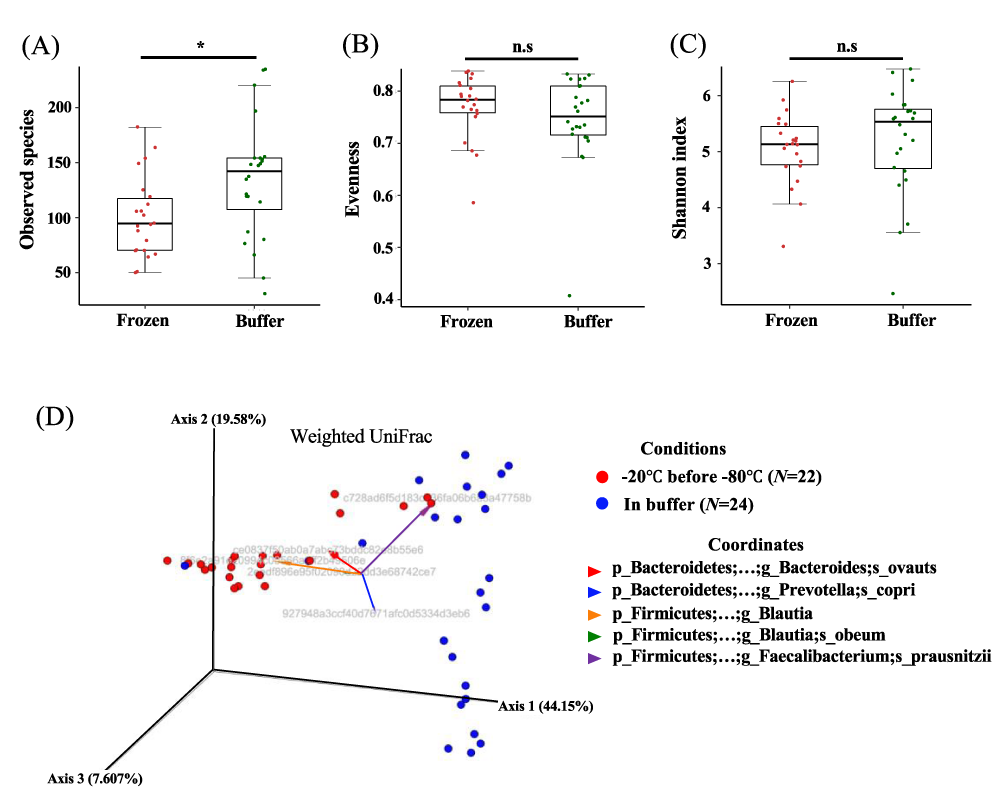
Figure 3: Alpha diversity and beta diversity of individual feces stored under different conditions. (a) Number of observed species, (b) evenness, and (c) Shannon index for frozen and buffer-preserved feces. (d) Weighted UniFrac beta diversity. Grey sentences are OTUs (Operational Taxonomic Units). n.s.: non-significant; *p < 0.05. Significance was evaluated by the Wilcoxon-Mann-Whitney U test. Whiskers error bars represent the distribution of alpha diversity values. The significance of differences in beta diversity was calculated by PERMANOVA with 999 permutations.
Metagenomic analysis of the microbial composition of feces under different storage conditions
Next, we performed taxonomic annotations of the microbes to detect differences between frozen and buffer-preserved fecal samples. We found that 6 phyla, 20 genera, and 15 species differed significantly between storage conditions (Table S2). The top 6 taxa at each level by count number are summarized (Figure 4). At the phylum level, Firmicutes was more abundant in frozen feces and Bacteroidetes was more abundant in buffer-preserved feces (Figure 4A,B, Figure S1). Interestingly, the abundance of Bacteroidetes was very low in frozen feces, whereas Firmicutes was abundant in buffer-preserved feces. Consequently, most genera (Figure 4C,D) and species (Figure 4E,F) included in these phyla differed significantly between frozen and buffer-preserved feces (Figure 4). Most results for species abundance were consistent with those for their corresponding phyla and genera. These results suggest that different fecal storage methods induce variation in the microbial composition of feces.
| Supplementary Table 2 | ||||||||
| Phylum | p - value | Frozen( )Buffer | Genus | p - value | Frozen( )Buffer | Species | p - value | Frozen( )Buffer |
| Actinobacteria | 3.19E-06 | > | Bifidobacterium | 3.55E-06 | > | B. adolescentis | 0.002435032 | > |
| B. longum | 0.005385121 | > | ||||||
| Bacteroidetes | 1.22E-07 | < | Bacteroides | 0.000484512 | < | B. ovatus | 0.020191891 | < |
| B. plebeius | 0.04109329 | < | ||||||
| B. uniformis | 0.007180944 | < | ||||||
| Parabacteroides | 0.003123641 | < | P. distasonis | 0.000635814 | < | |||
| Prevotella | 0.013097259 | < | P. copri | 0.057820223 | < | |||
| Firmicutes | 1.04E-07 | > | Blautia | 1.04E-07 | > | B. obeum | 0.001660642 | > |
| Lachnospira | 1.18E-05 | < | - | - | - | |||
| Ruminococcus | 6.15E-06 | > | R. gnavus | 9.67E-06 | > | |||
| R. bromii | 0.026121427 | > | ||||||
| Dorea | 2.14E-06 | > | D. formicigenerans | 0.015119466 | > | |||
| Faecalibacterium | 0.000528379 | < | F. prausnitzii | 0.000528379 | < | |||
| Oscillospira | 0.001195305 | < | - | - | - | |||
| SMB53 | 0.000339951 | > | - | - | - | |||
| Streptococcus | 0.000458297 | > | - | - | - | |||
| Coprococcus | 0.000283426 | > | C. catus | 0.017942251 | > | |||
| Lactobacillus | 0.005014775 | > | L. ruminis | 0.01664354 | > | |||
| Bacillus | 0.011836243 | > | - | - | - | |||
| Dialister | 0.042317988 | > | - | - | - | |||
| Weissella | 0.047639457 | > | - | - | - | |||
| Lentisphaerae | 0.002763407 | < | Victivallis | 0.033440164 | < | V. vadensis | 0.033440164 | < |
| Proteobacteria | 0.032208327 | < | Bilophila | 0.035402977 | < | - | - | - |
| Sutterella | 3.42E-07 | < | - | - | - | |||
| Euryarchaeota | 0.109019463 | > | - | - | - | - | - | - |
| Microbial taxa with differences in abundance between frozen and buffer-preserved feces. Metagenomic annotation revealed microbes with differences in abundance at the phylum, genus, and species levels. Significance was evaluated by the Wilcoxon-Mann-Whitney U test. The > symbol indicates which storage condition had a larger mean relative abundance. Unclassified microbes are marked with the - sign. | ||||||||
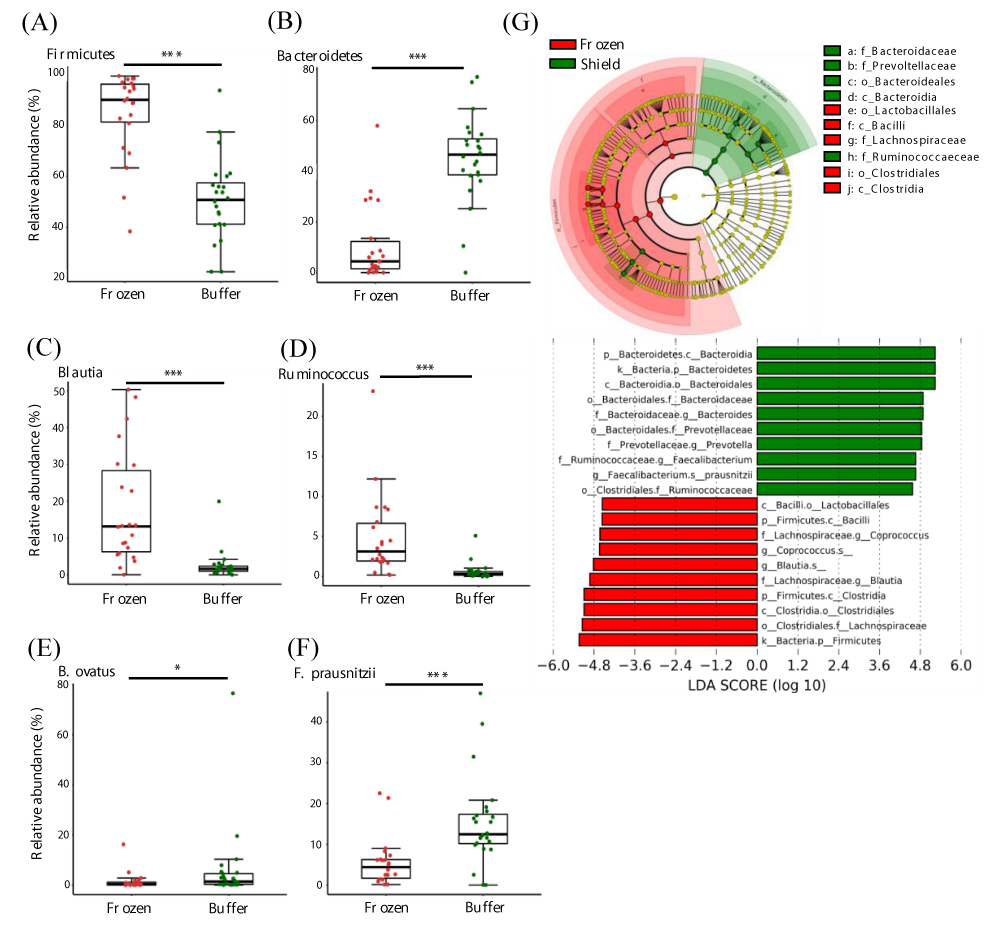
Figure 4: Differences in microbial abundances between frozen and buffer-preserved feces. Relative abundance of various microbes with different abundances (a and b) at the phylum level, (c and d), genus level, and (e and f) species level. (g) A taxonomic cladogram and a plot of linear discriminant analysis (LDA) scores from linear discriminant analysis effect size (LEfSe) illustrating the microbes that differ significantly between frozen and buffer-preserved feces (|LDA score| > 4.5). Each panel is ordered by the maximum relative abundance (a–f). *p < 0.05; ***p < 0.0005. Significance was evaluated by the Wilcoxon-Mann-Whitney U test. Whiskers error bars represent the distribution of observed relative abundance.
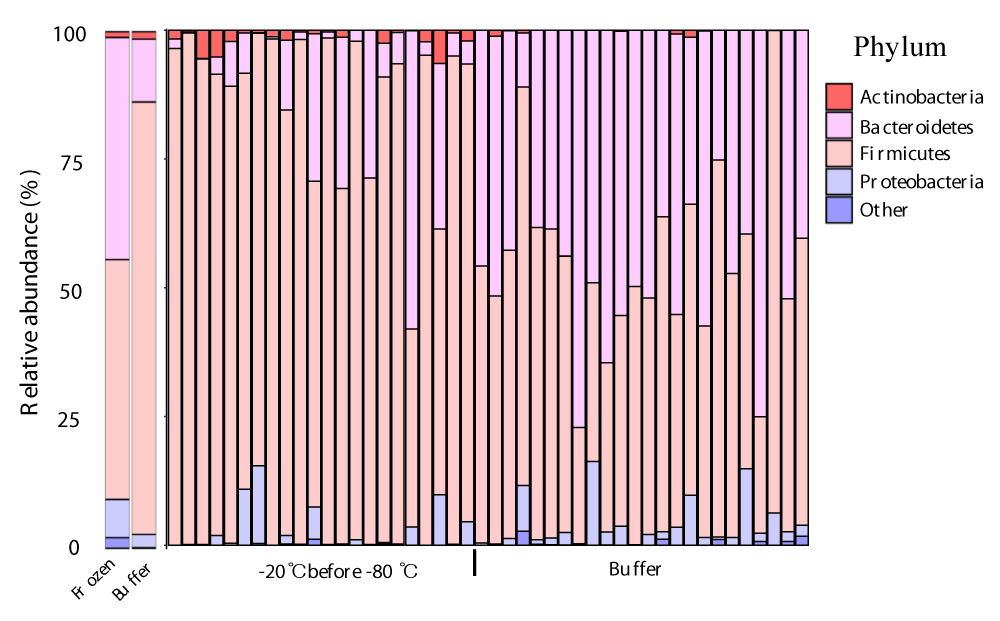
Supplementary Figure 1: Relative abundance of microbes in fecal samples at the phylum level for different storage methods Bar graph describing the relative abundance of two types of frozen and buffer-preserved feces in (Left) intra-sample and (Right) inter-sample comparisons.
In this study, we collected fecal samples from donors with lung cancer to investigate the effects of different storage conditions of the results of population metagenomic analyses. Here, we used a lung cancer cohort because it was readily available to us and lung cancer is not thought to be correlated with dramatical microbial changes unlike colon cancer, although recent studies have emphasized the association of microbiome with cancer [ 25-28]. Moreover, the previous studies of healthy human cohorts revealed that each person has a distinct gut microbiome signatures, thus microbiome of healthy human population shows relatively broader range of bacterial diversity [29-32]. Feces were stored frozen at -80 °C and in preservation buffer. We found that differences in fecal storage induced compositional differences of the gut microbial community and caused inter-population variation. In particular, we that differences in the abundance of the main phyla that Firmicutes and Bacteroidetes were major factor splitting the population into two microbial communities. Most genera and species with differences in abundance belonged to Firmicutes and Bacteroidetes, but other phyla also differed in abundance between frozen and buffer-preserved feces. Overall, our results suggest that credible and accurate population metagenomic analyses without bias require the use of a single storage method and highly controlled conditions.
Differences in DNA extraction kits, sequencing platforms, and analysis tools can cause further bias and variation in the results of metagenomic analyses. Accordingly, a consistent experimental method is essential [2,7,8,17]. For example, we sequenced the 16S rRNA region using the Illumina MiSeq platform targeting the V3–V4 region and mapped sequence reads to the GreenGenes database [3,33,34]. We obtained sequence reads for each sample with no differences in read counts between the two storage conditions. To join the sequence reads and filter low-quality reads, DADA2 was used through QIIME2, which is a fast and accurate tool for metagenomic analyses [21,35,36]. We observed a difference in the number of paired-end reads, suggesting that different storage conditions could yield different microbial information.
The Shannon index is usually used to evaluate alpha diversity, accounting for abundance and evenness [37]. In this study, we found that evenness in frozen feces tended to higher than that in buffer-preserved feces. We conjectured that this difference reduced the gap in the Shannon index, despite the huge difference with respect to species. The opposite result was obtained by Menke et al., who revealed that alpha diversity is higher in frozen feces than buffer-preserved feces in sheep [38]. This difference may be explained by different characteristics between humans and sheep microbiota composition [39,40]. Variation in alpha diversity among individual donors is often observed and can be explained by diet, lifestyle, and genetic factors [41-43]. These characteristics supersedes the individual variation in alpha diversity. To compare microbial diversity between populations, we plotted individuals based on weighted UniFrac distances. Even though donors had a broad range of alpha diversity values, beta diversity showed that the microbial distance depended on storage methods. This result suggested that the storage method may influence the microbial composition in feces.
In the present study, we identified taxa to determine specific microbes that differed between frozen feces and buffer-preserved feces. Consistent with previous findings [44,45], we observed that Firmicutes was more abundant in frozen feces than in buffer-preserved feces, while Bacteroidetes was more abundant in buffer-preserved feces. Importantly, the amount of Bacteroidetes was low in frozen feces, even though Bacteroidetes are known to inhabit the gastrointestinal tract of humans [45,46]. This could be explained by the different type of cell walls between Firmicutes and Bacteroidetes. Faecalibacterium was more abundant in buffer-preserved feces than in frozen samples by up to 4-fold. This increase in Faecalibacterium was also observed in other studies using alternative buffers [6]. As Firmicutes increased, downstream genera and species also increased in frozen feces. Lentisphaerae and Fusobacteria are normally detected in feces at low abundances [47,48], but the relative abundance were zero in frozen feces and were low in buffer-preserved feces. These differences in some microbial taxa may give result in biases and unbalanced metagenomic analyses.
This study had some limitations. First, comparisons of the same fecal sample using different storage methods to evaluate intra-sample variation were not performed. However, we collected feces from donors within the same type (patients with lung cancer), providing homogenization and sufficiently superseding intra-individual comparisons. Second, only one type of preservation buffer was used for the comparative analysis. Comparisons among various preservation buffers should be a focus of further studies. In fact, many studies have compared various buffers [6,15,18,49], but the reproducibility of results should be established. Finally, further studies are needed to demonstrate inter-individual variation with respect to fecal storage conditions, using fecal samples collected from other populations to establish the generalizability of our findings.
Ethics approval and consent to participate
All samples were obtained after informed consent for participate under written forms at the Samsung Medical Center. This study was approved by Samsung Medical Center Institutional Ethics Committee with the US Ministry of Health and the Institutional Review Board (IRB ) in accordance with the Declaration of Helsinki (2008-06-033).
Consent for publication
All samples were obtained with informed consent for publication at the Samsung Medical Center.
Data summary
The 16S rRNA sequencing data are available in European Nucleotide Archive repository, (Accession #: ERP116098). The datasets generated and analyzed during the current study are available from the corresponding author on reasonable request.
Author contribution
G.K analyzed 16S rRNA sequences, made figures and wrote the manuscript. C.P wrote the manuscript. K.H.K analyzed 16S rRNA sequences. S.K edited the manuscript and figures. Y.Y edited the manuscript. S.E.L edited figures. Y.K edited. manuscript. K.W.Y and H.P designed and supervised all experiments and analysis. All authors have read and approved the manuscript.
We would like to thank to Drs. Se-Hoon Lee for collecting and allowing us to use the feces from patients and his support.
Athours notes
All supporting data and protocols have been provided within the article or through supplementary data files. †These authors contributed equally to this work.
Funding
This research was supported by the Bio Medical Technology Development Program of the National Research Foundation (NRF) which was funded by the Ministry of Science & ICT(NRF-2017M3A9F3046536) and GIST Research Institute (GRI) grant which was funded by the GIST in 2018, 2019 and 2020.
- Sekirov I, Russell SL, Antunes LCM, Finlay BB. Gut microbiota in health and disease. Physiol Rev. 2010; 90: 859-904. PubMed: https://pubmed.ncbi.nlm.nih.gov/20664075/
- Oulas A, Pavloudi C, Polymenakou P, Pavlopoulos GA, Papanikolaou N, et al. Metagenomics: Tools and insights for analyzing next-generation sequencing data derived from biodiversity studies. Bioinform Biol Insights. 2015; 9: 75-88. PubMed: https://pubmed.ncbi.nlm.nih.gov/25983555/
- Falony G, Joossens M, Vieira-Silva S, Wang J, Darzi Y, et al. Population-level analysis of gut microbiome variation. Science. 2016; 352; 560-564. PubMed: https://pubmed.ncbi.nlm.nih.gov/27126039/
- He Y, Wu W, Zheng HM, Li P, McDonald D, et al. Regional variation limits applications of healthy gut microbiome reference ranges and disease models. Nat Med. 2018; 24: 1532-1535. PubMed: https://pubmed.ncbi.nlm.nih.gov/30150716/
- Ong IM, Gonzalez JG, McIlwain SJ, Sawin EA, Schoen AJ, et al. Gut microbiome populations are associated with structure-specific changes in white matter architecture. Transl Psychiatry. 2018; 8: 6. PubMed: https://pubmed.ncbi.nlm.nih.gov/29317592/
- Choo JM, Leong LE, Rogers GB. Sample storage conditions significantly influence faecal microbiome profiles. Sci Rep. 2015; 5: 16350.
- Costea PI, Zeller G, Sunagawa S, Pelletier E, Alberti A, et al. Towards standards for human fecal sample processing in metagenomic studies. Nat Biotechnol. 2017; 35: 1069-1076. PubMed: https://pubmed.ncbi.nlm.nih.gov/28967887/
- Gerasimidis K, Bertz M, Quince C, Brunner K, Bruce A, et al. The effect of dna extraction methodology on gut microbiota research applications. BMC Res Notes. 2016; 9: 365. PubMed: https://www.ncbi.nlm.nih.gov/pmc/articles/PMC4960752/
- Shaw AG, Sim K, Powell E, Cornwell E, Cramer T, et al. Latitude in sample handling and storage for infant faecal microbiota studies: The elephant in the room? Microbiome. 2016; 4: 40. PubMed: https://pubmed.ncbi.nlm.nih.gov/27473284/
- Thomas V, Clark J, Doré J. Fecal microbiota analysis: An overview of sample collection methods and sequencing strategies. Future Microbiol. 2015; 10: 1485-1504. PubMed: https://pubmed.ncbi.nlm.nih.gov/26347019/
- Clemente JC, Pehrsson EC, Blaser MJ, Sandhu K, Gao Z, et al. The microbiome of uncontacted amerindians. Sci Adv. 2015; 1: e1500183. PubMed: https://pubmed.ncbi.nlm.nih.gov/26229982/
- Cardona S, Eck A, Cassellas M, Gallart M, Alastrue C, et al. Storage conditions of intestinal microbiota matter in metagenomic analysis. BMC Microbiol. 2015; 12: 158. PubMed: https://pubmed.ncbi.nlm.nih.gov/22846661/
- Roesch LF, Casella G, Simell O, Krischer J, Wasserfall CH, et al. Influence of fecal sample storage on bacterial community diversity. Open Microbiol J. 2009; 3, 40-46. PubMed: https://pubmed.ncbi.nlm.nih.gov/19440250/
- Stephan J, Ott MM, Timmis KN, Hampe J, Wenderoth DF, et al. In vitro alterations of intestinal bacterial microbiota in fecal samples during storage. Diagn Microbiol Infect Dis. 2004; 50: 237-245. PubMed: https://pubmed.ncbi.nlm.nih.gov/15582296/
- Gorzelak MA, Gill SK, Tasnim N, Ahmadi-Vand Z, Jay M, et al. Methods for improving human gut microbiome data by reducing variability through sample processing and storage of stool. PLoS One. 2015; 10: e0134802. PubMed: https://pubmed.ncbi.nlm.nih.gov/26252519/
- Voigt AY, Costea PI, Kultima JR, Li SS, Zeller G, et al. Temporal and technical variability of human gut metagenomes. Genome Biol. 2015; 16: 73. PubMed: https://pubmed.ncbi.nlm.nih.gov/25888008/
- Blekhman R, Tang K, Archie EA, Barreiro LB, Johnson ZP, et al. Common methods for fecal sample storage in field studies yield consistent signatures of individual identity in microbiome sequencing data. Sci Rep. 2016; 6: 31519. PubMed: https://pubmed.ncbi.nlm.nih.gov/27528013/
- Bundgaard-Nielsen C, Hagstrom S, Sorensen S. Interpersonal variations in gut microbiota profiles supersedes the effects of differing fecal storage conditions. Sci Rep. 2018; 8: 17367. PubMed: https://pubmed.ncbi.nlm.nih.gov/30478355/
- Davis MP, van Dongen S, Abreu-Goodger C, Bartonicek N, Enright AJ. Kraken: A set of tools for quality control and analysis of high-throughput sequence data. Methods. 2016; 63: 41-49. PubMed: https://pubmed.ncbi.nlm.nih.gov/23816787/
- Martin M. Cutadapt removes adapter sequences from high-throughput sequencing reads. 2011; 17: 3.
- Bolyen E, Rideout JR, Dillon MR, Bokulich NA, Abnet C, et al. Qiime 2: Reproducible, interactive, scalable, and extensible microbiome data science. 2018; 2167-9843.
- Segata N, Izard J, Waldron L, Gevers D, Miropolsky L, et al. Metagenomic biomarker discovery and explanation. Genome Biol. 2011; 12: R60. PubMed: https://pubmed.ncbi.nlm.nih.gov/21702898/
- Team RC. R: A language and environment for statistical computing. 2013.
- Wickham H. Ggplot2: Elegant graphics for data analysis. 2016.
- Bhatt AP, Redinbo MR, Bultman SJ. The role of the microbiome in cancer development and therapy. CA Cancer J Clin. 2017; 67: 326-344. PubMed: https://pubmed.ncbi.nlm.nih.gov/28481406/
- Song W, Anselmo AC, Huang L. Nanotechnology intervention of the microbiome for cancer therapy. Nat Nanotechnol. 2019; 14: 1093-1103. PubMed: https://pubmed.ncbi.nlm.nih.gov/31802032/
- Wang J, Jia H. Metagenome-wide association studies: Fine-mining the microbiome. Nat Rev Microbiol. 2016; 14: 508-522. PubMed: https://pubmed.ncbi.nlm.nih.gov/27396567/
- Zhuang H, Wang Y, Zhang YK, Zhao MF, Liang GD, et al. Dysbiosis of the gut microbiome in lung cancer. Front Cellular Infect Microbiol. 2019; 9: 112. PubMed: https://www.ncbi.nlm.nih.gov/pmc/articles/PMC6489541/
- Cameron SJ, Huws SA, Hegarty MJ, Smith DP, Mur LA. The human salivary microbiome exhibits temporal stability in bacterial diversity. FEMS Microbiol Ecol. 2015; 91: fiv091. PubMed: https://pubmed.ncbi.nlm.nih.gov/26207044/
- Claesson MJ, Cusack S, O'Sullivan O, Greene-Diniz R, de Weerd H, et al. Composition, variability, and temporal stability of the intestinal microbiota of the elderly. Proc Nat Acad Sci. 2011; 108: 4586-4591. PubMed: https://pubmed.ncbi.nlm.nih.gov/20571116/
- Costello EK, Lauber CL, Hamady M, Fierer N, Gordon JI, Knight R. Bacterial community variation in human body habitats across space and time. Science. 2009; 326: 1694-1697. PubMed: https://pubmed.ncbi.nlm.nih.gov/19892944/
- Oh J, Byrd AL, Park M, Kong HH, Segre JA, et al. Temporal stability of the human skin microbiome. Cell. 2016; 165: 854-866. PubMed: https://pubmed.ncbi.nlm.nih.gov/27153496/
- Ilumina. 16s metagenomic sequencing library preparation. Part #15044223 Rev. 2015; 1-28.
- McDonald D, Price MN, Goodrich J, Nawrocki EP, DeSantis TZ, et al. An improved greengenes taxonomy with explicit ranks for ecological and evolutionary analyses of bacteria and archaea. ISME J. 2012; 6: 610-618.
- Callahan BJ, McMurdie PJ, Rosen MJ, Han AW, Johnson AJ, et al. Dada2: High-resolution sample inference from illumina amplicon data. Nat Methods. 2016; 13: 581-583. PubMed: https://pubmed.ncbi.nlm.nih.gov/27214047/
- Hughes R, Alkan Z, Keim NL, Kable ME. Impact of sequence variant detection and bacterial dna extraction methods on the measurement of microbial community composition in human stool. bioRxiv. 2017; 212134.
- Bibi F, Ali Z. Measurement of diversity indices of avian communities at taunsa barrage wildlife sanctuary, pakistan. J Animal Plant Sci. 2013; 23: 469-474.
- Menke S, Gillingham MAF, Wilhelm K, Sommer S. Home-made cost effective preservation buffer is a better alternative to commercial preservation methods for microbiome research. Front Microbiol. 2017; 8: 102. PubMed: https://pubmed.ncbi.nlm.nih.gov/28197142/
- Ellis RJ, Bruce KD, Jenkins C, Stothard JR, Ajarova L, Mugisha L, et al. Comparison of the distal gut microbiota from people and animals in africa. PLoS One. 2013; 8: e54783. PubMed: https://pubmed.ncbi.nlm.nih.gov/23355898/
- Lee JE, Lee S, Sung J, Ko G. Analysis of human and animal fecal microbiota for microbial source tracking. ISME J. 2011; 5: 362-365. PubMed: https://pubmed.ncbi.nlm.nih.gov/20686512/
- Davenport ER, Cusanovich DA, Michelini K, Barreiro LB, Ober C, et al. Genome-wide association studies of the human gut microbiota. PLoS One. 2015; 10: e0140301. PubMed: https://pubmed.ncbi.nlm.nih.gov/26528553/
- David LA, Materna AC, Friedman J, Campos-Baptista MI, Blackburn MC, et al. Host lifestyle affects human microbiota on daily timescales. Genome Biol. 2014; 15: R89. PubMed: https://pubmed.ncbi.nlm.nih.gov/25146375/
- David LA, Maurice CF, Carmody RN, Gootenberg DB, Button JE, et al. Diet rapidly and reproducibly alters the human gut microbiome. Nature. 2014; 505-559. PubMed: https://pubmed.ncbi.nlm.nih.gov/24336217/
- Bahl MI, Bergstrom A, Licht TR. Freezing fecal samples prior to dna extraction affects the firmicutes to bacteroidetes ratio determined by downstream quantitative pcr analysis. FEMS Microbiol Lett. 2012; 329: 193-197. PubMed: https://pubmed.ncbi.nlm.nih.gov/22325006/
- Fouhy F, Deane J, Rea MC, O'Sullivan O, Ross RP, et al. The effects of freezing on faecal microbiota as determined using miseq sequencing and culture-based investigations. PLoS One. 2015; 10: e0119355. PubMed: https://pubmed.ncbi.nlm.nih.gov/25748176/
- Rios-Covian D, Salazar N, Gueimonde M, de los Reyes-Gavilan CG. Shaping the metabolism of intestinal bacteroides population through diet to improve human health. Front Microbiol. 2017; 8. 376. PubMed: https://pubmed.ncbi.nlm.nih.gov/28326076/
- Allen-Vercoe E, Jobin C. Fusobacterium and enterobacteriaceae: Important players for crc? Immunol Lett. 2014; 162: 54-61. PubMed: https://pubmed.ncbi.nlm.nih.gov/24972311/
- Fugmann M, Breier M, Rottenkolber M, Banning F, Ferrari U, et al. The stool microbiota of insulin resistant women with recent gestational diabetes, a high risk group for type 2 diabetes. Sci Rep. 2015; 5: 13212. PubMed: https://pubmed.ncbi.nlm.nih.gov/26279179/
- Wu WK, Chen CC, Panyod S, Chen RA, Wu MS, et al. Optimization of fecal sample processing for microbiome study - the journey from bathroom to bench. J Formos Med Assoc. 2019; 118: 545-555. PubMed: https://pubmed.ncbi.nlm.nih.gov/29490879/