
More Information
Submitted: December 28, 2021 | Approved: January 19, 2022 | Published: January 20, 2022
How to cite this article: Ting P, Kasam A, Lan K. Applications of convolutional neural networks in chest X-ray analyses for the detection of COVID-19. Ann Biomed Sci Eng. 2022; 6: 001-007.
DOI: 10.29328/journal.abse.1001015
Copyright License: © 2022 Ting P, et al. This is an open access article distributed under the Creative Commons Attribution License, which permits unrestricted use, distribution, and reproduction in any medium, provided the original work is properly cited.
Keywords: Convolutional neural networks; Neural networks; Chest X-ray images; ResNet 50; MobileNet V2; Artificial intelligence; VGG16; Artificial intelligence in medicine

Applications of convolutional neural networks in chest X-ray analyses for the detection of COVID-19
Patrick Ting1*, Anish Kasam2 and Kevin Lan3
1San Ramon Valley High School, USA
2Dublin High School, USA
3San Marino High School , USA
*Address for Correspondence: Patrick Ting, San Ramon Valley High School, USA, Email: [email protected]
Throughout global efforts to defend against the spread of COVID-19 from late 2019 up until now, one of the most crucial factors that has helped combat the pandemic is the development of various screening methods to detect the presence of COVID-19 as conveniently and accurately as possible. One of such methods is the utilization of chest X-Rays (CXRs) to detect anomalies that are concurrent with a patient infected with COVID-19. While yielding results much faster than the traditional RT-PCR test, CXRs tend to be less accurate. Realizing this issue, in our research, we investigated the applications of computer vision in order to better detect COVID-19 from CXRs. Coupled with an extensive image database of CXRs of healthy patients, patients with non-COVID-19 induced pneumonia, and patients positive with COVID-19, convolutional neural networks (CNNs) prove to possess the ability to easily and accurately identify whether or not a patient is infected with COVID-19 in a matter of seconds. Borrowing and adjusting the architectures of three well-tested CNNs: VGG-16, ResNet50, and MobileNetV2, we performed transfer learning and trained three of our own models, then compared and contrasted their differing precisions, accuracies, and efficiencies in correctly labeling patients with and without COVID-19. In the end, all of our models were able to accurately categorize at least 94% of the CXRs, with some performing better than the others; these differences in performance were largely due to the contrasting architectures each of our models borrowed from the three respective CNNs.
With over 180 million confirmed cases and nearly 4 million fatalities as shown by Figure #1, the COVID-19 pandemic is one of the deadliest viruses to have ever plagued our planet. For over a year and a half, a myriad of scientists with an expertise in infectious disease have been steadily developing detection methods for COVID-19 [15]. The most prominent method for identifying patients infected with COVID-19 is the RT-PCR test, which takes up to 2 days to yield results. However, this test is not always accurate and a secondary test is occasionally required to confirm results. An alternative method involves using CXRs to detect anomalies in the chest region that may indicate the presence of COVID-19. While more widely available and much more efficient than the traditional RT-PCR test, CXRs tend to be less accurate (Figure 1).
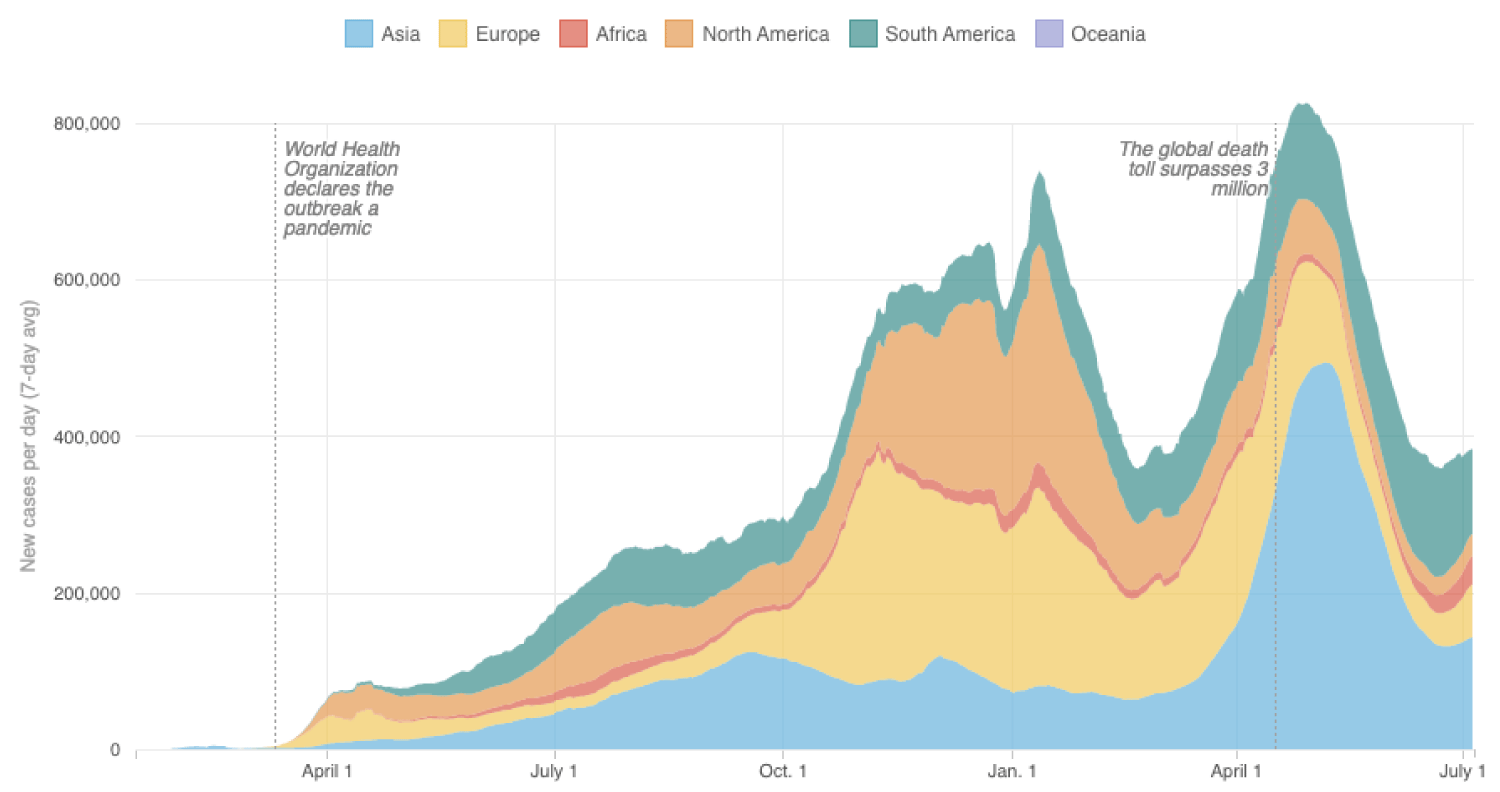
Figure 1: Graph of reported coronavirus cases, per continent over the past year [26].
A thorough review of many preceding studies reveals that, out of a plethora of tested classification methods, utilizing well-built CNNs has proved to be the optimal method for bridging the gap in accuracy when using CXRs to detect COVID-19 [2]. In a recent study of COVID-19 detection through the use of CNNs, researchers utilized the base architecture of VGG16, a well-established CNN, and modified their model to be attention-based; in other words, their model is able to analyze the relationships in the often ignored regions of interests in CXRs in order to more accurately detect COVID-19. Their model was able to reach a maximum accuracy of 87.49% [21]. In a similar study, a team of researchers fine-tuned various models that utilized state-of-the-art CNNs such as MobileNetV2 and ResNet50, and trained and tested them on a large dataset of CXRs, and were subsequently able to achieve classification accuracies of 94% and higher [8]. In yet another study, a research team created COVID-Net, a novel CNN design for the detection of COVID-19 cases from CXRs, which yielded a maximum efficacy rate of 93.3% [24]. The subject of applying machine learning in disease detection, specifically COVID-19, has a multitude of pre-existing studies that not only display the results of integrating CNNs in CXR classification, but also demonstrate the promise that such models show in the field of medicine and disease diagnosis as a whole [7,10,18].
The main goal of our research is to explore the differences in accuracy between multiple well-established CNNs as well as to curtail the impact of overfitting on CNNs [9]. As three types of CNNs, VGG16, ResNet50, as well as MobileNetV2 with vastly different topologies and functionalities, we would like to juxtapose each of the respective CNNs’ computational precision and efficiency to ultimately identify the most optimal CNN architecture with respect to image classification. We will reference and modify the architectures of VGG16, ResNet50, and MobileNetV2 to best fit our data, then evaluate the resulting models against the same dataset to determine which base architecture is most effective at detecting COVID-19 from CXRs. Specifically, we will stack five additional layers to each CNN to elicit hierarchical decomposition of our input data to increase the accuracy and specificity of the models. We believe that our novel approach will also diminish the effect of overfitting our model to specific datasets by enhancing the CNNs’ ability to independently differentiate between various features of the CXR. Overall, we intend to examine and analyze various CXR-complementing CNNs to determine the most efficient, accurate, and convenient replacement to the traditional time-consuming, less available RT-PCR test.
Dataset
Before comparing the performance of the various CNNs, we had to obtain a dataset to train, validate, and test our model. Through the use of Kaggle’s publicly available datasets, we obtained a large image dataset of CXRs [12]. These images were compiled from various open source data repositories, including COVID-19 CXR Dataset Initiative [1], CXR Images (Pneumonia) [11], and COVID-19 Image Data Collection [3]. In total, there are 6,432 images of CXRs in the comprehensive dataset that we used. The data was split up into 2 folders: train and test, each containing 3 subfolders or classes: COVID-19 (positive), non-COVID-19 induced pneumonia (negative), and normal (negative), samples of which are depicted in Figure 2. However, we also wanted to include a validation dataset to better tune the hyperparameters of our models, so we partitioned the test dataset into two roughly equal parts and used one half for our validation data. In the end, roughly 80% of the data was for training (5144 images), 10% was for validation (620 images), and 10% was for testing (688 images).
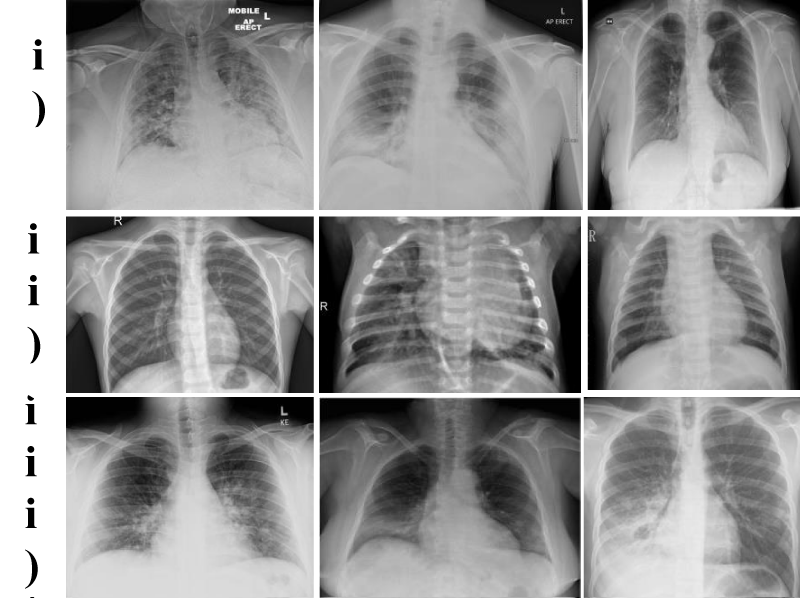
Figure 2: Example CXRs from the compiled dataset which pulls from three different data repositories: (i) COVID-19 Chest X-Ray Dataset Initiative [1], (ii) Chest X-Ray Images (Pneumonia) [11], and (iii) COVID-19 Image Data Collection [3], all images already present within Kaggle’s dataset of CXRs.
Data preprocessing
Because the CXRs from the dataset we utilized were largely preprocessed, we only needed to use Keras’ built-in image processing functions to ensure that all inputs were optimized for our models before training [22]. Specifically, the Keras function sets all the images to a 224 by 224 pixel standard before applying the model to them. Additionally, to account for any inherent tilt angle present in the CXRs, basic augmentations, translations, and rotations were performed to adjust the inputs to the model.
VGG16
In 2015, the VGG16 architecture won the ImageNet Challenge, a renowned annual competition that evaluates object detection models. Today, it remains as one of the most used architectures for image and object detection [21]. Unlike other CNNs, VGG16 employs smaller receptive fields, stride lengths, and convolutional filters. This allows the architecture to incorporate more weight layers which lead to an increased accuracy [20]. VGG16 is comprised of a total of 16 layers (1 input layer, 1 output layer, and 14 hidden convolution layers), and, as shown in Figure 3, it makes use of various activation functions such as ReLU and softmax. Additionally, through the integration of max pooling, the filtered image originates from the highest pixel value of each set of 9 pixels from the original image.
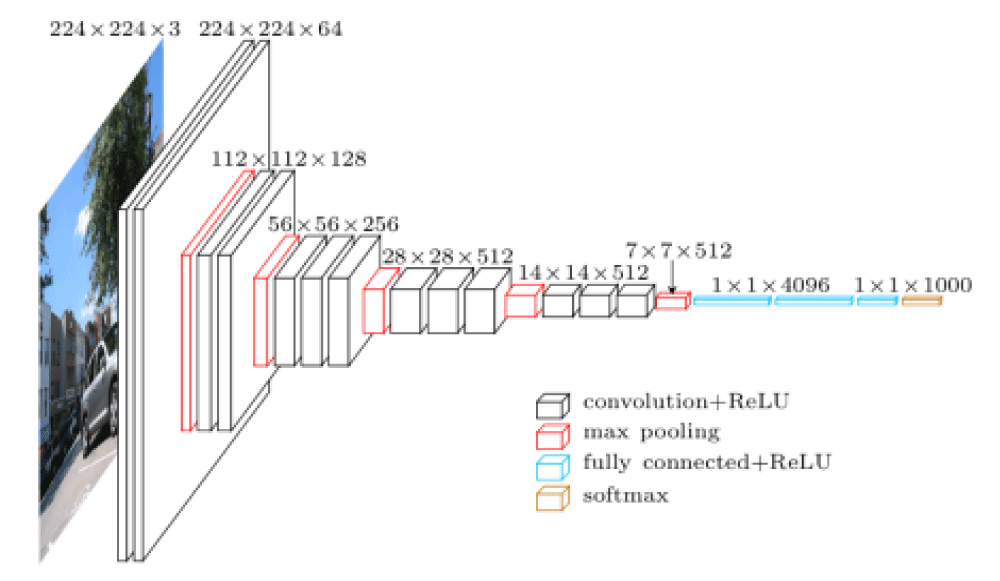
Figure 3: Visualization of the VGG16 neural network and layers. There are multiple layers that utilize max pooling and various activation functions which helps to standardize the input data [23].
ResNet50
Like VGG16, ResNet50 is also an object detection CNN. However, uniquely, ResNet50 is a multilayer residual neural network in which neurons possess the capability to skip past certain connections to avoid the common degradation problem. In other words, the 50-layer network can maintain maximum data precision despite the fact that a model’s accuracy tends to decrease with its passage through many layers [5]. As depicted in Figure 4, with 1 input layer, 1 output layer, and 48 hidden convolution layers, each of the convolution layers serve as a filter that scans the entirety of the inputted image to reduce the overall size of the image. Through each filter, max pooling is implemented to extract only the highest value as the target value. Thus, a new, more compact image data matrix is generated and run through the rest of the network.
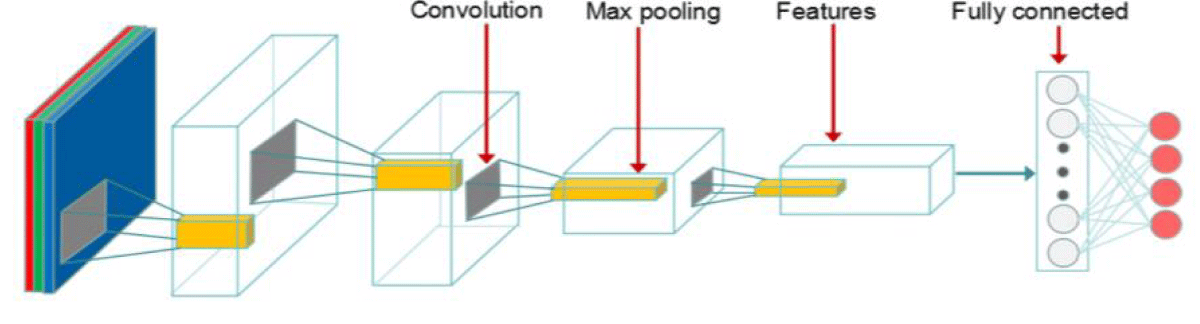
Figure 4: Visualization of the ResNet50 neural network and its 50 layers. The convolutions are separated from the fully connected neural network and thus the model does not need to iterate through every neuron in the network [14].
MobileNetV2
Unlike VGG16 and ResNet50, MobileNetV2’s architecture employs depthwise separable convolutions, which require significantly less computational power from standard convolutions [6]. Despite being significantly more lightweight and efficient than many other well-established networks, MobileNetV2 is still just as accurate as other state-of-the-art models such as VGG16 and GoogleNet [13]. As depicted by Figure 5, MobileNetV2 utilizes 53 convolutional layers, with a batch normalization function and a ReLU activation function following each layer [6].
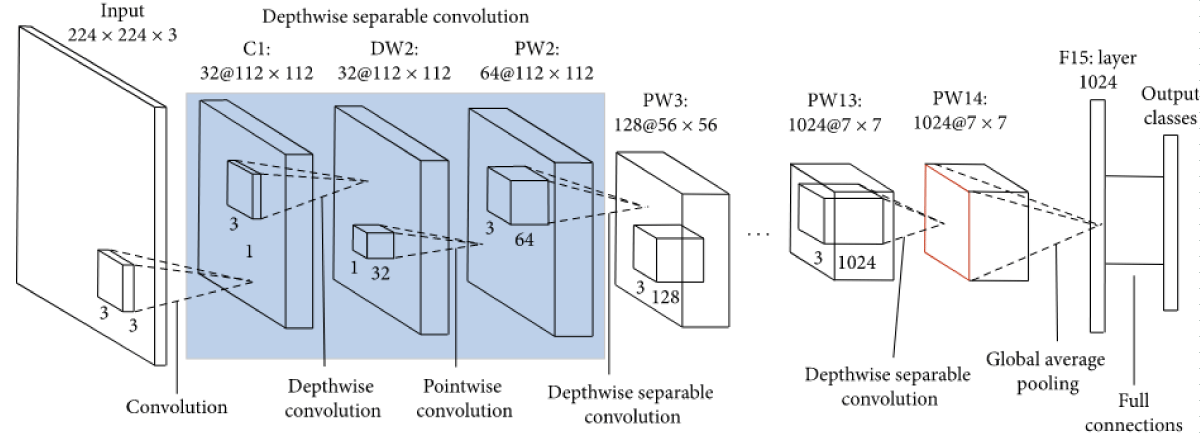
Figure 5: Visualization of the MobileNet neural network and layers. The depthwise separable convolutions are highlighted, and the global average pooling is also designated [25].
Transfer learning and implementation details
Each of our models inherited a base architecture of either VGG16, Resnet50, or MobileNetV2 and were implemented using the open source deep learning library Keras and Tensorflow as a backend [16]. Additionally, all models had their initial weights instantiated to those derived from pretraining on the renowned ImageNet dataset [4].
A major problem faced when applying a CNN to a database is that of overfitting our model to a specific database. To tailor our models to better classify any input data of CXRs, we added two pairs of Dense and Dropout layers at the end of each architecture to prevent the aforementioned overfitting issue, as well as a final Dense layer using softmax as the activation function with an output size of three, the number of classes designated in our model (COVID-19, normal, and non-COVID-19 induced pneumonia). With these novel additions and approaches, we believe that we have taken an advancement in the development of CNN models to improve their differentiating abilities and decrease the inherent influence of bias on image classification.
Additionally, we set all parameters to be trainable for our VGG16-based model, approximately 45% of the parameters to be trainable for our ResNet50-based model, and approximately 99% of the parameters to be trainable for our MobileNetV2-based model. The VGG16-based model and MobileNetV2-based model were able to accommodate a higher number of trainable parameters due to the lightweight nature of their respective architectures.
All models were trained and evaluated on the modified Kaggle dataset. The train dataset contained a total of 5144 CXRs, the validation dataset contained 620 CXRs, and the test/evaluation dataset contained 688 CXRs. As for hyperparameters, we trained on 12 epochs for each model, used the Adam optimizer, a learning rate of 1 * 10-4, factor of 0.2, patience of 4, verbose of 1, minimum delta of 5 * 10-3, minimum learning rate of 5 * 10-7, and batch size of 8 and ran the trial five times per model to reduce error.
Hardware specifications
Taking advantage of Google’s free, browser-friendly service Colaboratory, we trained all of our models on a runtime utilizing a NVIDIA Tesla K80 GPU.
Evaluation criteria
Because the goal of our models is to output whether a given CXR indicates a patient positive or negative for COVID-19, we utilized four appropriate metrics to measure our models’ evaluations on our test dataset: accuracy, sensitivity, specificity, and F1-score [17]. The formulas for the following metrics are as follows:
Accuracy: proportion of correct predictions to total predictions
Sensitivity: proportion of correctly predicted positives to total positive predictions
Specificity: proportion of correctly predicted negatives to total negative predictions
F1-score: harmonic mean of specificity and sensitivity
To calculate the metrics listed above, we found the number of true positives, true negatives, false positives, and false negatives outputted by each model and calculated the metrics using the above formulas.
The aforementioned values were also used to generate a confusion matrix for each model, illustrated by Figures 6-8 though we combined CXRs indicating non-COVID-19 induced pneumonia and normal CXRs into the negative for COVID-19 category, and CXRs indicating a COVID-19 infection into the positive for COVID-19 category as to create a binary classification confusion matrix for easier visualization.
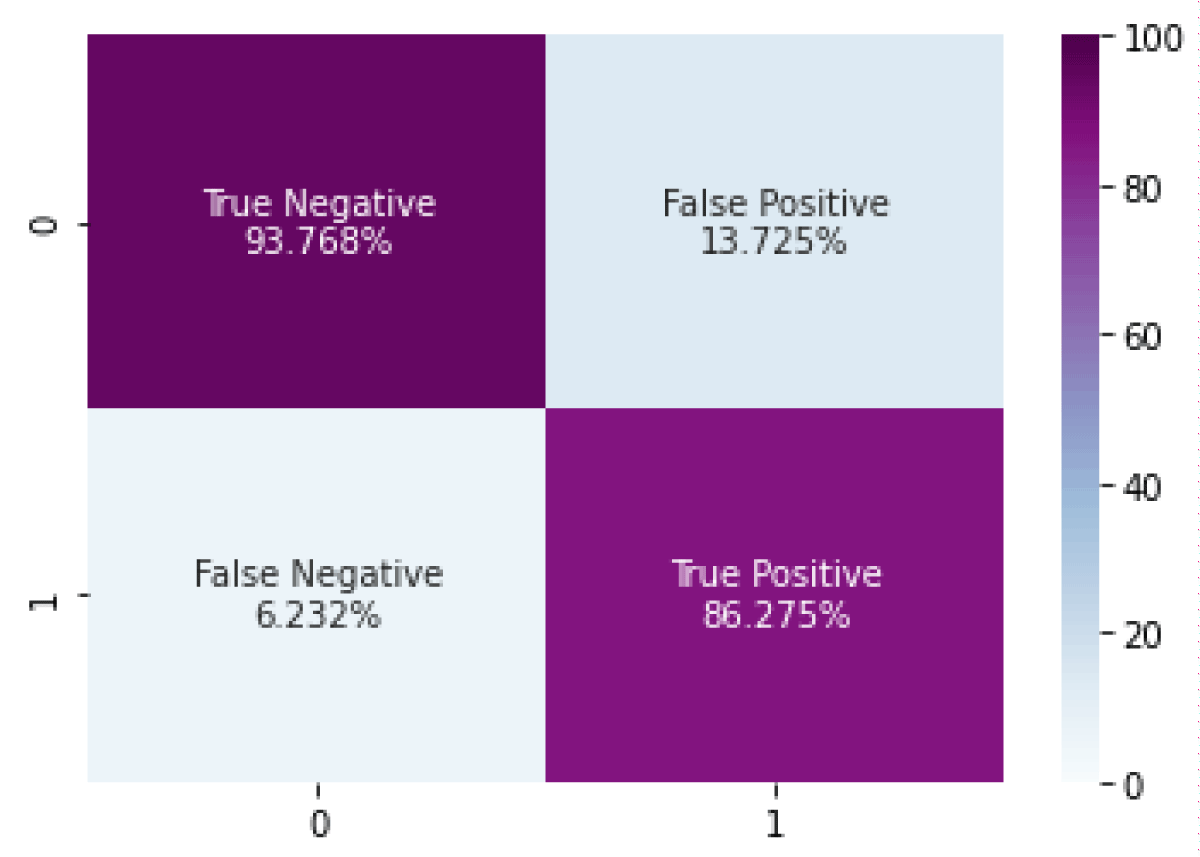
Figure 6: Confusion matrix for the VGG16-based model (TN: 93.768%, FP: 13.725%, FN: 6.232%, TP: 86.275%).
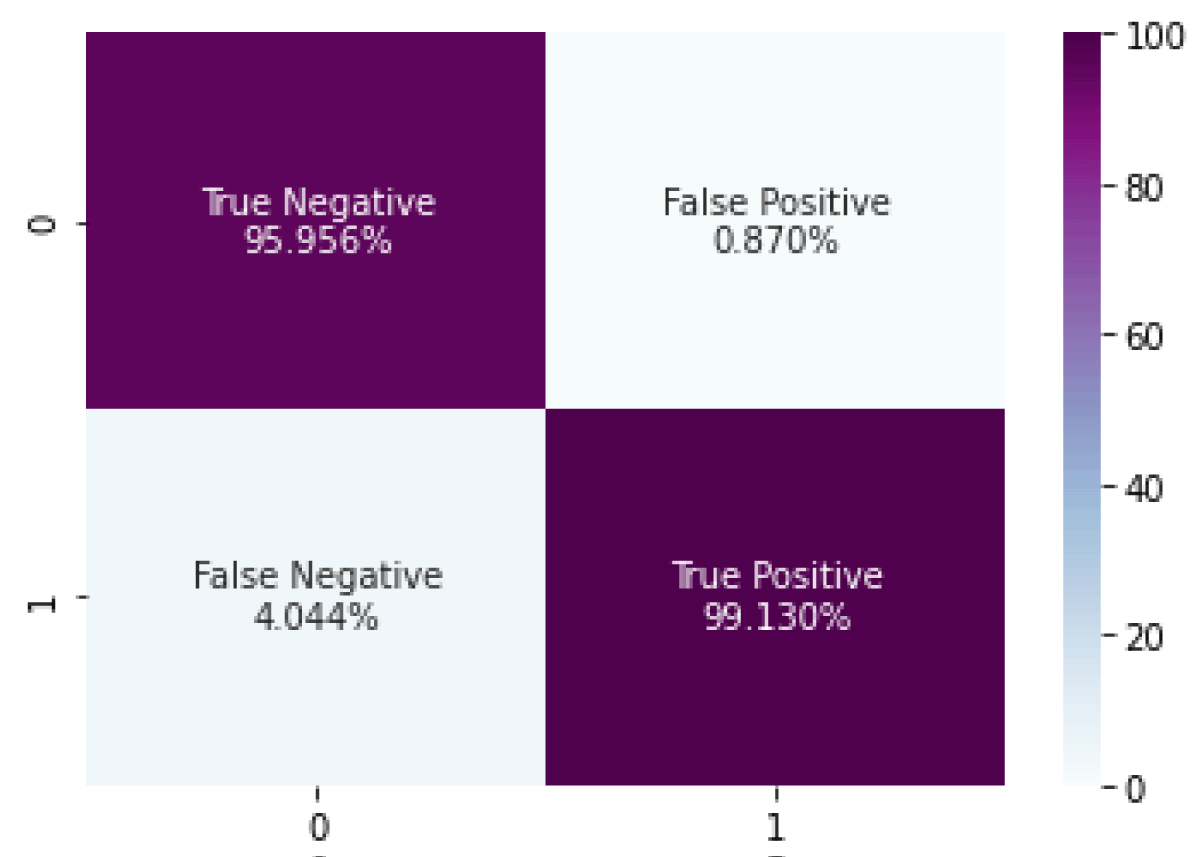
Figure 7: Confusion matrix for the ResNet50-based model (TN: 95.956%, FP: 0.870%, FN: 4.044%, TP: 99.130%).

Figure 8: Confusion matrix for the MobileNetV2-based model (TN: 95.869%, FP: 8.411%, FN:4.131%, TP: 91.589%).
Model performance
Table 1 showing the average values for accuracy, sensitivity, specificity, mean F1 score, and runtime for each model over five trials). Bolded entries indicate the best results for a given metric.
Model comparison
Overall, all three of our models are able to efficiently and accurately classify image inputs due to their selective networking connections, compared to a traditional model utilizing a fully connected neural network, in which each and every neuron is connected to each other. Regarding the advantages of the specific models, the model utilizing VGG16 as its base architecture proved to show the lowest accuracy due to the significantly greater number of parameters it requires to operate. However, due to the relatively low number of layers in the base architecture (16 layers), it was able to yield results more efficiently [19]. On the contrary, ResNet50’s architecture contains 50 layers, which is more than triple the number of layers in the VGG16 model, and it does not need to reference every neuron in the network. Due to the higher number of layers and parameter requirements, the model utilizing ResNet50 as its base architecture less efficiently yielded results. Simultaneously, with its ability to evaluate a smaller sample pool of neurons instead of iterating through every neuron in each layer, ResNet50 is able to maintain an elevated accuracy, thus justifying the model utilizing ResNet50’s architecture as having the highest accuracy. Lastly, MobileNetV2 is also a considerably more heavyweight neural network model in juxtaposition with VGG16’s architecture, utilizing 53 layers. Although the higher number of layers and lower number of parameters in the model using MobileNetV2 as its base architecture provides itself with a practical advantage in accuracy, it requires a lengthier evaluation time and loses efficiency when compared to VGG16 and ResNet50 [25]].
To quantify and contrast the varying accuracies and speeds each model produces, we computed the Area Under The Curve-Receiver Operating Characteristics (AUC-ROC) values including accuracy, sensitivity, and specificity for each of the three CNN models after testing each model with 688 CXRs, as well as the mean F1-scores for each of the three classification categories of COVID-19, normal, and non-COVID-19 induced pneumonia. The resulting values are as follows: VGG16 yielded an accuracy of 94.16%, a sensitivity of 93.26%, a specificity of 87.23%, and a mean F1-score of 91.27%; ResNet50 yielded an accuracy of 97.16%, a sensitivity of 96.08%, a specificity of 99.10%, and a mean F1-score of 97.01%; and MobileNetV2 yielded an accuracy of 96.56%, a sensitivity of 95.68%, a specificity of 91.93%, and a mean F1-score of 94.44%.
Note that Table 1 also shows the accuracies of various other models from prior studies on the applicability of using CNNs to classify CXRs; these numbers should only be used for reference, as the methodologies and metrics used and calculated for each of the respective studies differ such that an accurate comparison cannot be made [8,21,24].
Additionally, we conducted three statistical tests to further compare the percent accuracy of our three models. With all three models evaluating on the same test dataset of 688 CXRs, the model utilizing VGG16 correctly identified 648 CXRs, the model utilizing ResNet50’s architecture correctly identified 669 CXRs, and the model utilizing MobileNetV2’s architecture correctly identified 664 CXRs out of 688 total CXRs. The null hypothesis of these 3 tests was that there is no significant difference between the proportions of the accuracies for the compared models, and the alternative hypothesis for the three tests was that there is a significant difference between the proportions of the accuracies for the compared models. In order to reject the null hypothesis and validate the alternative hypothesis, our p - value, which represents the probability of obtaining results at least as extreme as the observed results of the statistical hypothesis test, must be less than the accepted alpha level of 0.05. We obtained the p - value through using the t-test functionality of a standard TI-84 graphing calculator.
First, we implemented a t-test for difference in proportions for the accuracies of VGG16 and Resnet50, and our computed p - value was 0.005198. We then executed another t-test to evaluate the difference in proportions for the accuracy of VGG16 and MobileNetV2, and our computed p - value was 0.04054. Finally, we conducted a third t-test for the difference in proportions for the accuracy of ResNet50 and MobileNetV2, which resulted in a p - value of 0.4385.
In Figures 9-11, the x-axis represents z-score, the y-axis represents probability density, the pink shaded region represents the p - value, and the green line/marker represents a p - value of 0.05.
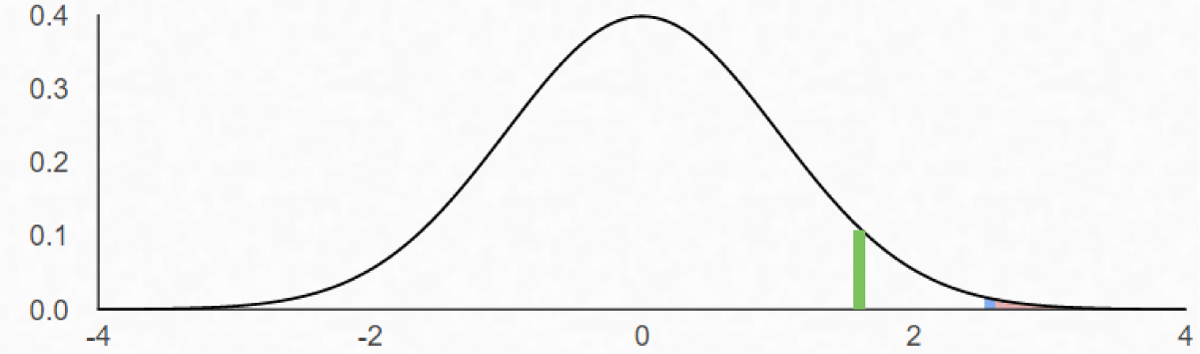
Figure 9: The area under the normal distribution curve bounded by the blue line represents the p - value of the t - test conducted to evaluate the difference between proportions for the accuracy of VGG16 and ResNet50.
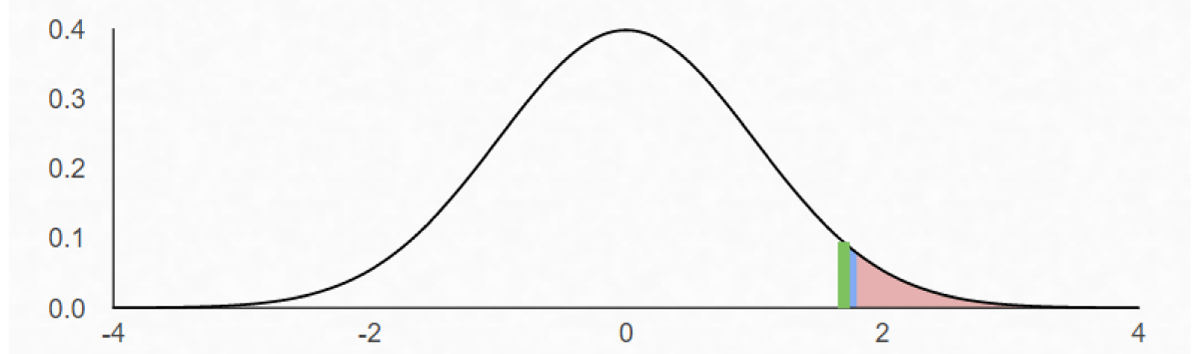
Figure 10: The area under the normal distribution curve bounded by the blue line represents the p - value of the t - test conducted to evaluate the difference between proportions for the accuracy of VGG16 and MobileNetV2.
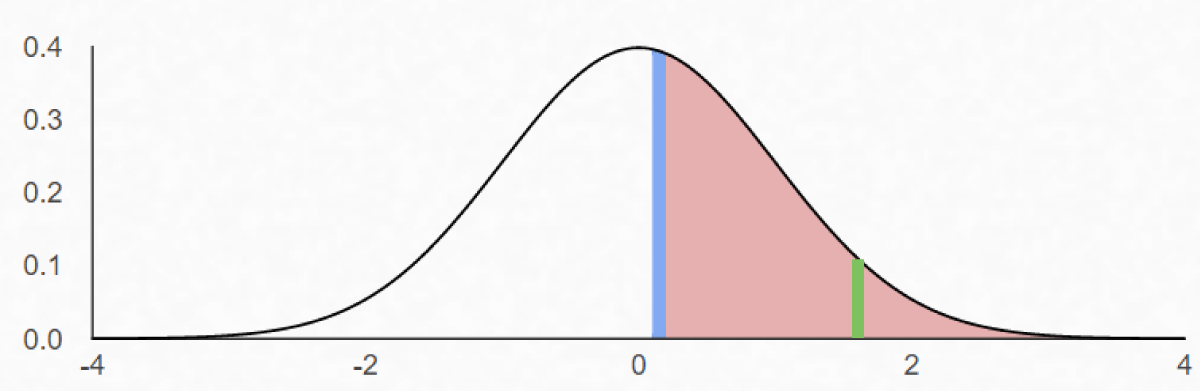
Figure 11: The area under the normal distribution curve bounded by the blue line represents the p - value of the t - test conducted to evaluate the difference between proportions for the accuracy of ResNet50 and MobileNetV2
After conducting the statistical tests, we analyzed the collected p - values of each individual study at the alpha level of 0.05. We concluded that the differences in accuracies between VGG16 and Resnet50 as well as between VGG16 and MobileNetV2 were significant since the calculated p - values from those two tests were lower than the alpha level of 0.05. However, the computed p - value for the difference in accuracies between ResNet50 and MobileNetV2 was above the alpha level of 0.05, so we cannot conclude that ResNet50 is more accurate.
In terms of evaluation time, VGG16 required 165 seconds, ResNet50 required 176 seconds, and MobileNetV2 required 188 seconds to complete evaluation on the test dataset. With regards to identifying the most optimal CNN model, we prioritized accuracy over evaluation time since the individual evaluation times for each model all lied within 160-190 seconds. Both ResNet50 and MobileNetV2 proved to be marginally more accurate than VGG16. However, since the difference in the accuracies of ResNet50 and MobileNetV2 were not statistically significant, we took the models’ individual efficiencies into consideration, in which ResNet50 required approximately 12 fewer seconds than the MobilenetV2-based model to execute its program on the set of test images. Thus, we concluded that for the purpose of correctly classifying patients’ CXRs, ResNet50 proves to possess the most optimal architecture to use out of the three proposed architectures.
Optimistically and confidently, we anticipate an immense growth in the prevalence of implementing CNNs to detect the presence of COVID-19 in any given patient as prior studies prove it to surpass state-of-the-art COVID-19 detection methods in both efficiency and accuracy. In the future, we plan on standardizing our methods and datasets to better compare with other studies, as well as focus on further increasing the sensitivity and specificity of our models, which will subsequently increase their accuracies. If perfected and improved, the usage of CNNs in COVID-19 detection possesses the potential to extend far beyond the classification of CXRs, and instead, permanently shape the way in which artificial intelligence can function in the field of medicine and disease diagnosis.
Data availability
The source code for this project as well as links for our trained models and dataset used are available at https://github.com/kevinjl321/cxr-net.
We would like to express our gratitude to our supervisors: Ryan Solgi, Ph. D., Laboni Sarker, Ph. D., and S. Shailja who guided us throughout this project.
Author contribution statement
All authors conceived the experiments. K.L. implemented, trained, and tested all models and their respective architectures, as well as generated the confusion matrices for each model. P.T conducted the appropriate statistical tests and assisted in testing and training the models. All authors analyzed the results. All authors reviewed the manuscript.
- Chung AG. Agchung/Figure1-COVID-Chestxray-Dataset. GitHub. github.com/agchung/Figure1-COVID-chestxray-dataset
- Cohen JP. COVID-19 Image Data Collection: Prospective Predictions Are the Future. ArXiv. 2020; 2006; 11988:
- Cohen JP. ieee8023/Covid-Chestxray-Dataset. GitHub. github.com/ieee8023/covid-chestxray-dataset
- Fei-Fei L. Image Net. image-net.org/about.php
- He K. Deep Residual Learning for Image Recognition. Proceedings of the IEEE Conference on Computer Vision and Pattern Recognition (CVPR).
- Howard A, Zhu M, Chen B, Kalenichenko D, Wang W, et al. Mobilenets: Efficient convolutional neural networks for mobile vision applications. arXiv. 2017; 1704: 04861.
- Islam N, Ebrahimzadeh S, Salameh JP, Kazi S, Fabiano N, et al. Thoracic imaging tests for the diagnosis of COVID-19. Cochrane Database Syst Rev. 2021; Art. No.: CD013639. https://pubmed.ncbi.nlm.nih.gov/32997361/
- Kc K. Evaluation of deep learning-based approaches for COVID-19 classification based on chest X-ray images. Signal, image and Video Processing. 2021; 1-8.
- Kelly CJ, Karthikesalingam A, Suleyman M, et al. Key challenges for delivering clinical impact with artificial intelligence. BMC Med. 2019; 17: 195.
- Chowdhury MEH. Can AI Help in Screening Viral and COVID-19 Pneumonia? in IEEE Access. 2020; 8: 132665-132676.
- Mooney P. Chest X-Ray Images (Pneumonia). Kaggle. 2018. www.kaggle.com/paultimothymooney/chest-xray-pneumonia
- Patel P. Chest X-Ray (Covid-19 & Pneumonia). Kaggle. 2020. https://www.kaggle.com/prashant268/chest-xray-covid19-pneumonia
- Srudeep PA. An Overview on MobileNet: An Efficient Mobile Vision CNN. Medium. 2020. medium.com/@godeep48/an-overview-on-mobilenet-an-efficient-mobile-vision-cnn-f301141db94d
- Peng J, Kang S, Ning Z, Deng H, Shen J, et al. Residual Convolutional Neural Network for Predicting Response of Transarterial Chemoembolization in Hepatocellular Carcinoma from CT Imaging. Eur Radiol. 2019; 30: 413-424. https://pubmed.ncbi.nlm.nih.gov/31332558/
- Rubin GD, Ryerson CJ, Haramati LB, Sverzellati N, Kanne JP, et al. The Role of Chest Imaging in Patient Management during the COVID-19 Pandemic: A Multinational Consensus Statement from the Fleischner Society. Chest. 2020; 158: 106-116. https://pubmed.ncbi.nlm.nih.gov/32275978/
- Sahinbas K, Catak FO. Transfer learning-based convolutional neural network for COVID-19 detection with X-ray images. Data Science for COVID-19. 2021: 451–466. https://www.ncbi.nlm.nih.gov/pmc/articles/PMC8138118/
- Sekeroglu B, Ozsahin I. Detection of COVID-19 from Chest X-Ray Images Using Convolutional Neural Networks. SLAS Technol. 2020; 25: 553-565.
- Senthilraja M. Application of Artificial Intelligence to Address Issues Related to the COVID-19 Virus. SLAS Technol. 2021; 26: 123-126. https://pubmed.ncbi.nlm.nih.gov/33390088/
- Shaikh F. Advanced Architectures: Deep Learning Architectures. Analytics Vidhya. 2020. www.analyticsvidhya.com/blog/2017/08/10-advanced-deep-learning-architectures-data-scientists/
- Simonyan K, Zisserman A. Very deep convolutional networks for large-scale image recognition. arXiv preprint arXiv: 2014; 1409: 1556.
- Sitaula C, Hossain MB. Attention-based VGG-16 model for COVID-19 chest X-ray image classification. Appl Intell. 2020; 1-14. https://pubmed.ncbi.nlm.nih.gov/34764568/
- Thakur R. Step by step VGG16 implementation in Keras for beginners. Towards Data Science – Medium. 2019. https://towardsdatascience.com/step-by-step-vgg16-implementation-in-keras-for-beginners-a833c686ae6c
- VGG16 - Convolutional Network for Classification and Detection. 2021. neurohive.io/en/popular-networks/vgg16/
- Wang L, Lin ZQ, Wong A. COVID-Net: a tailored deep convolutional neural network design for detection of COVID-19 cases from chest X-ray images. Sci Rep. 2020; 10: 19549.
- Wang W, Li Y, Zou T, Wang X, You J, Luo Y. A Novel Image Classification Approach via Dense-MobileNet Models. Mobile Information Systems. 2020; 2020: 7602384.
- Wood D. Coronavirus World Map: We've Now Passed. The 180 Million Mark For Infections. NPR. 2021. www.npr.org/sections/goatsandsoda/2020/03/30/822491838/coronavirus-world-map-tracking-the-spread-of-the-outbreak