
More Information
Submitted: June 23, 2022 | Approved: July 01, 2022 | Published: July 04, 2022
How to cite this article: Zhang W, Tan H, Du Y, Li Y, Su W, et al. Enhancing functional expression of L-glycerophosphate oxidase in Escherichia coli by controlling the expression rate. Ann Biomed Sci Eng. 2022; 6: 008-013.
DOI: 10.29328/journal.abse.1001016
Copyright License: © 2022 Zhang W, et al. This is an open access article distributed under the Creative Commons Attribution License, which permits unrestricted use, distribution, and reproduction in any medium, provided the original work is properly cited.
Keywords: Glycerophosphate oxidase; Expression level; Specific activity; Lac promoter; Ribosome binding site

Enhancing functional expression of L-glycerophosphate oxidase in Escherichia coli by controlling the expression rate
Wenyu Zhang1, Huanbo Tan1, Yuanyuan Du1, Yafeng Li1, Wencheng Su1, Michael Sattler1-3 and Peijian Zou1-3*
1National Engineering Laboratory for Industrial Enzymes, Tianjin Institute of Industrial Biotechnology, Chinese Academy of Sciences, Tianjin, China
2Institute of Structural Biology, Helmholtz Center Munich, National Research Center for Environmental Health, Neuherberg, Germany
3Center for Integrated Protein Science Munich at Chair Biomolecular NMR Spectroscopy, Department Chemie, Technische Universität München, Garching, Germany
*Address for Correspondence: Peijian Zou, Institute of Structural Biology, Helmholtz Center Munich, National Research Center for Environmental Health, Neuherberg, Germany, Email: [email protected]; [email protected]
Heterologous expression of proteins often pursues high expression levels, but it can easily result in misfolding and loss of biological function. L-α-glycerophosphate oxidase (GlpO) is a flavin adenine dinucleotide (FAD)-dependent oxidase which is widely used in the clinical determination of triglycerides. We found that the total enzymatic activity of GlpO expressed in Escherichia coli (E. coli) was extremely low, probably due to the absence of FAD cofactors and the misfolding of GlpO at a high synthesis rate. Therefore, decreasing the expression rate was used to improve the activity of GlpO. The specific activity of GlpO expressed on the pUC19 vector with lac promotor was approximately 30 times higher than that expressed on the pET28a vector with T7 promotor, but the expression levels of GlpO on the two vectors were completely opposite. It indicated that the specific activity of GlpO was increased as the expression level decreased. However, too low expression greatly influences the total amount and activity of the functional enzyme. In order to resolve this problem, two new plasmids, GlpO-CG4 and GlpO-CG6, were constructed by inserting 4 or 6 nucleotides, respectively, between the ribosome binding site (RBS) and the start code (ATG) on pET28a. Compared with the expression on the GlpO-pET vector, the expression rates of GlpO on the GlpO-CG4 and GlpO-CG6 were dramatically decreased. The total activity of GlpO expressed on GlpO-CG6 was 11 times and 1.5 times higher than that expressed on the GlpO-pET and GlpO-pUC, respectively. Results suggest that the activity of GlpO can be improved by decreasing the expression rate.
GlpO (EC 1.1.3.21) is a flavoprotein oxidase containing FAD as a cofactor. The enzyme catalyzes the oxidation of α-glycerophosphate (a metabolic intermediate in lipid and glycerol metabolism) to generate dihydroxyacetone phosphate (DHAP) and hydrogen peroxide (H2O2), using O2 as the final electron acceptor [1, 2]. GlpO has been isolated and characterized by some pathogens, such as Mycoplasma [3, 4], Enterococcus [5], Streptococcus [6], and Aerococcus [7]. Studies have shown that the resultant H2O2 is one of the major virulence factors for these pathogens [8, 9]. In connection with its important function in lipid and glycerol metabolism, GlpO is widely used in the enzymatic determination of plasma triglycerides coupling with lipoprotein lipase and glycerol kinase in the clinical analysis [10].
In view of the great value of GlpO in clinical determination, obtaining enough high-activity GlpO is the prerequisite for clinical application. Traditionally, GlpO is isolated from natural bacteria sources and can be induced by glycerol [7, 11]. But low levels of expression and complex cultural conditions lead to considerable costs for GlpO production. E. coli is considered to be an excellent host for heterogeneous expression. The usage of strong promotors and codon optimization in a heterogeneous protein expression system can significantly improve expression levels [12-14]. It has been reported that protein production can be increased by more than 1000 times through codon optimization [13]. Additionally, the 5′ untranslated regions (UTR) and N-terminal codon usage is thought to be the rate-controlling step for translation, which can affect protein expression with a wide dynamic range [15-18]. For example, nucleotide changes to the spacer sequence can modulate expression by up to 1000-fold, and optimization of the first ten codons of target genes is capable of increasing functional expression as much as 500-fold [17, 19].
However, as the recombinant proteins often fail to fold properly and form non-functional particles at high synthesis rates, it is essential to control the expression rate to achieve a high level of functional expression of the target protein [20]. A previous study conducted by Zhang, et al. reported that the IPTG inducer concentration influences the bioactivity of GlpO. The high specific activity of GlpO was achieved at a low concentration of IPTG. They inferred that the high synthesis rate might lead to incomplete attachment of FAD, an indispensable factor for GlpO activity, onto GlpO when induced under a high concentration of IPTG [21]. Therefore, in order to improve the activity of GlpO, it is necessary to increase the amount of holo-GlpO by reducing the protein folding rate.
Here, we improved the activity of GlpO by two strategies different from Zhang’s method mentioned above. In this study, the GlpO gene from Carnobacterium was cloned and expressed in E. coli. The expression rates of GlpO were controlled by different promotors and increasing GC content via inserting extra nucleotides between the RBS and the start code (ATG) on the pET28a plasmid. The relationship between activity, expression rate, and FAD content was clarified and discussed. A novel modified low-expression-rate vector was constructed to obtain the maximal functional expression and activity of GlpO. Our study suggested that the designed vectors could be used for the other protein expressions which require different expression rates.
Plasmid constructions
The gene sequence for GlpO was designed by “reverse translation” of an amino acid sequence from Carnobacterium. The DNA sequence was optimized according to the codon usage of E. coli and synthesized by Genewiz Co. (Suzhou, China), not only to eliminate rare codons but to reduce the GC content to about 50%. The GlpO gene was cloned into pET28a (Novagen, USA) as a high-level expression vector using NcoI and XhoI restriction sites, resulting in the GlpO-pET plasmid. Meanwhile, the gene was cloned onto pUC19 with restriction sites of HindIII and EcoRI, leading to the plasmid GlpO-pUC as a low expression plasmid due to the lac promoter.
Two other recombinant plasmids were constructed by inserting additional GC bases between the SD-sequence and the start codon of the GlpO gene without shifting the reading frame of the GlpO gene (Figure 2). The insertion was carried out according to the QuickChange site-directed mutagenesis protocol (Stratagene, La Jolla, CA), using mutagenic oligonucleotides of 30 to 35 bases in length. Primers were designed and synthesized by Genewiz Co. as follows:
GlpO-CG4-F 5’-AAGAAGGAGATATACCCGGGATGCCGAAACTGTCTTTC-3’; GlpO-CG6-F5’-AAGAAGGAGATATACCCCGGGGATGCCGAAACTGTC-3’; GlpO-CG-R 5’-GGTATATCTCCTTCTTAAAGTTAAACAAAATTA-3’. The pET28a-GlpO plasmid was used as a template and digested by DpnI enzyme. All constructs were confirmed by DNA sequencing from Genewiz Co., China.
Expression and purification of GlpO
The plasmids containing the genes encoding the GlpO were transformed into E.coli BL21 (DE3). A single colony was picked randomly and cultured in a 5 mL LB medium (10 g/L tryptone, 5 g/L yeast extract, 10 g/L sodium chloride) overnight at 37 °C under vigorous shaking; 30 μg/mL kanamycin or 100 μg/mL ampicillin was added according to different expression vectors. Until the optical density of 0.6 at 600 nm was reached, different induction conditions were carried out with 0.1 mmol/L, 1 mmol/L IPTG at 25 °C or 30 °C for 12 h, as well as 0.1 mmol/L, 1 mmol/L IPTG at 16 °C for 20 h. The cells were harvested by centrifugation at 14000 rpm for 1 min and the cell pellets were suspended in 20 mM Tris/HCl buffer, pH 8.0, and lysed by sonication (2 min, 40% power, Fisher Scientific model 550) on ice. The insoluble fraction was removed by centrifugation at 14000 rpm for 1 h at 4 °C. The supernatants of the lysates were analyzed by 12% SDS–PAGE. The gels were stained with Coomassie Brilliant Blue R-250.
For a large-scale GlpO purification process, overnight cultures were grown in LB medium at 37 °C, diluted 50-fold, and grown in 1.0 L medium until an optical density of 0.6 at 600 nm was reached. Then IPTG was added with a final concentration of 0.1 mM and the bacteria were cultured for an additional 16 h at 25 °C. The cells were harvested by centrifugation at 6000 rpm for 30 min at 4 °C. The cells were resuspended in lysis buffer (20 mM Tris/HCl, 100 mM NaCl, 25 mM imidazole, pH 8.0, supplemented with 1 mg/mL lysozyme and 0.01 mg/mL DNase I), and lysed by pulsed sonication (10 min, 40% power, large probe, Fisher Scientific model 550) followed by centrifugation at 15000 rpm for 1 h.
All purification steps were performed on an ÄKTA chromatographic system (GE Healthcare, Uppsala, Sweden). The supernatant of the crude extract was loaded onto a 5 mL HiTrap Chelating affinity column (GE Healthcare) pre-equilibrated with the lysis buffer. The column was washed with the lysis buffer and the bound protein was eluted with elution buffer (20 mM Tris/HCl, 100 mM NaCl, 250 mM imidazole, pH 8.0). Fractions were collected and dialyzed against 20 mM Tris/HCl buffer (pH 8.0) overnight. The purity of the purified enzyme was determined by 10% SDS–PAGE, stained with Coomassie Brilliant Blue. Protein concentration was determined using a bicinchoninic acid (BCA) protein assay kit (CWBIO, china).
Activity assays
The activity of GlpO was measured by detecting the amount of H2O2 formed in the α-glycerophosphate oxidation reaction. 1-mole red quinone dye was produced in the presence of 2-mole hydrogen peroxide in a reaction mixture [11]. The reaction mixture contained 100 mmol/L α-glycerophosphate in 50 mM Tris/HCl buffer, pH 8.0, 2 mmol/L 4-Aminoantipyrine, 5 mmol/L phenol, 5 U horseradish peroxidase, and 0.4 U GlpO in a total volume of 0.2 mL. The absorbance of the dye was measured at 505 nm (ε = 6.58 mM−1 cM−1). One unit is defined as the formation of one micromole of hydrogen peroxide per minute.
Spectral Analyses
Absorbance spectra were measured using UV-1800 (Shimadzu, Japan). The cell path was 1 cm for the measurement at 450 nm. Tris buffer was used as control and the concentration of purified GlpO was normalized to 4 mg/mL. FAD content was determined using the known extinction coefficients (11.3 mM-1cm-1 at 450 nm) [22].
The GlpO was expressed from the pET vector
Driven by the T7 promotor, pET vectors are powerful systems for high levels of protein production in E. coli [23]. The synthetic codon-optimized gene of GlpO was cloned into the pET28a plasmid. The expression conditions were tested with different temperatures and IPTG concentrations. The soluble fractions were analyzed by SDS-PAGE (Figure 1A). It was clear that GlpO was expressed as a soluble protein below 25 °C and the maximal amount of soluble protein was obtained at 25 °C. If the cultivation temperature was increased to 30 °C, the soluble expression level of GlpO would be dramatically decreased. Due to the leaky expression, small amounts of GlpO were found in the soluble fraction before induction, but the highest enzymatic activity was detected in this control sample. This meant that the total activity of GlpO in the supernatants induced by IPTG was much lower than that in the control sample without induction (Figure 1B), even though the expression levels of the targeted protein were much higher under induction conditions. It was assumed that the total functional expression of GlpO might be affected by the expression level, and the loss of bioactivity was due to protein misfolding at high synthesis rates. Therefore, if the transcription or translation process of GlpO expression was under control and the expression rate of GlpO was reduced to a certain level without dramatically decreasing the expression level of the enzyme, it might help to obtain the correct folding of GlpO and to achieve a higher level of functional GlpO.
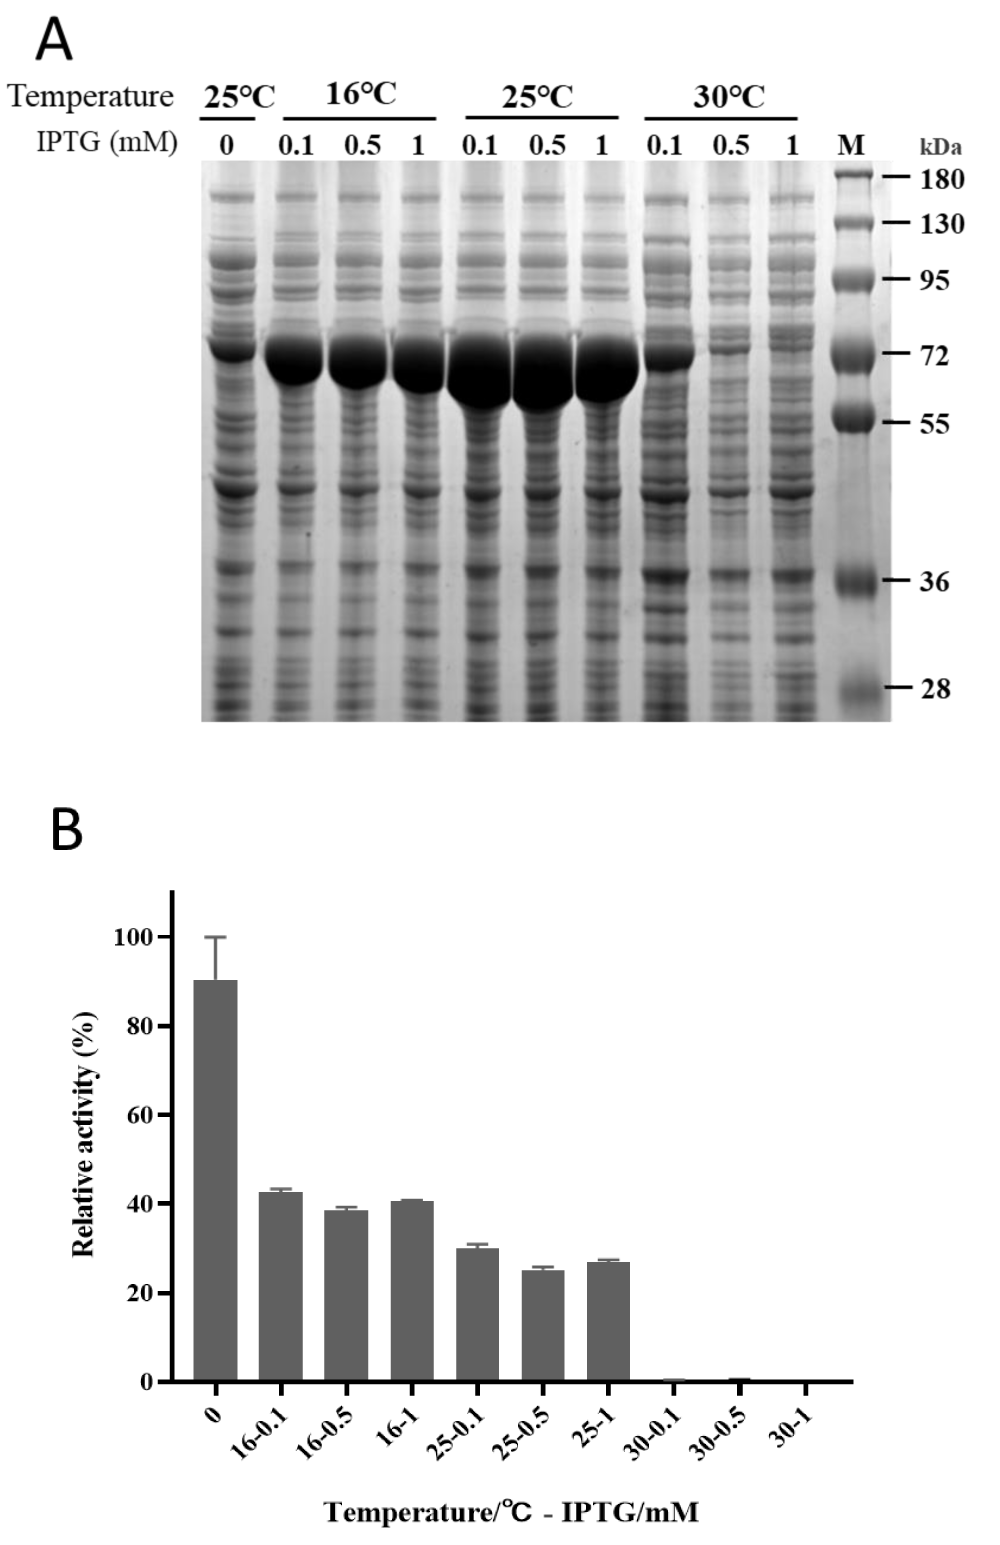
Figure 1: Expression analysis of a Carnobacterium GlpO in E. coli. A) GlpO-pET was expressed in the E. coli BL21 (DE3) at 16 °C (left), 25 °C(middle) or 30 °C (right) with 0.1, 0.5, 1 mM IPTG. Control cells were cultured at 25 °C without induction. Cells were lysed by sonification and soluble fractions were analyzed by SDS-PAGE after centrifugation. B) The supernatant activity of GlpO was determined after expression in the above conditions with 10 mM L-α-glycerophosphate as substrate.
The effect of expression level on the functional expression of GlpO
In order to control the expression rate and obtain high levels of the functional GlpO in E. coli, two strategies based on the regulation of transcription and translation rates were designed. First, a pUC19 plasmid with a lac promoter was chosen as the expression vector. Compared with the pET vector, which is controlled by the T7 promoter, the pUC with lac promotor produced a lower transcription level, which could decrease the expression level of GlpO [24]. Second, the two nucleotide sequences, ‘CGGG’ and ‘CCG GGG’, were inserted into the spacer sequence between the SD-sequence and the start codon to increase the GC content and extend the length of the spacer sequence, which could reduce the translation rate as well (Figure 2).
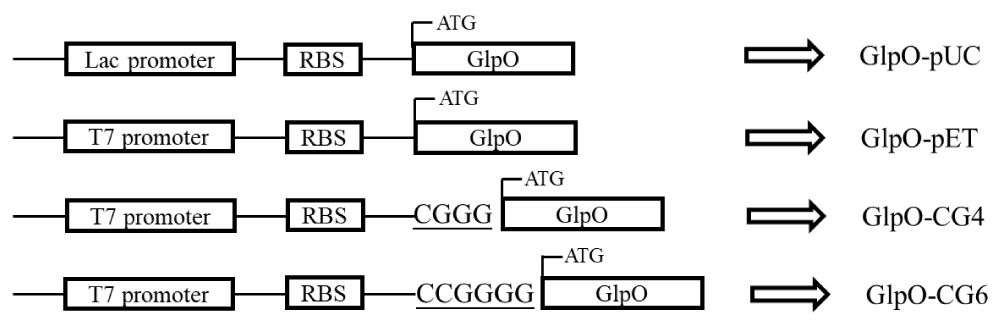
Figure 2: Schematic view of recombinant plasmid GlpO-pUC, GlpO-pET, GlpO-CG4, and GlpO-CG6. pUC19 plasmid was used as a lower expression strength plasmid with lac promotor. Sequence CGGG and CCG GGG were inserted into GlpO-pET between the RBS and start codon in the pET28a vector.
All of the recombinant GlpOs were expressed at 25 °C, which is the best expression condition according to the results above. The recombinant GlpOs were purified by a 5 mL HiTrap immobilized metal ion affinity chromatography column as described in the experimental procedures. The expression levels of the GlpO variants under different conditions were analyzed using SDS-PAGE (Figure 3A). The protein concentration of purified GlpO was determined by BCA assay, shown in Table 1. The results showed that expression levels of GlpO-pUC were remarkably lower compared to those of GlpO-pET. Meanwhile, the expression levels of GlpO on the two modified vectors, GlpO-CG4 and GlpO-CG6, were decreased and GlpO-CG6 was reduced much more than GlpO-CG4 after inserting two more nucleotides into the spacer sequence. This data showed that with the increase of spacer sequence length, the expression level decreased correspondingly. The total amounts of the four purified protein samples were obviously different with yields of 169.4 mg/L on pET-GlpO, 137.7 mg/L on GlpO-CG4, and 61.5 mg/L on GlpO-CG6. The protein expression level of GlpO-pUC was the lowest out of the four samples with a yield of about 35.8 mg/L, as the lac promotor provides lower transcriptional efficiency than the T7 promoter (Figure 3A, Table 1). The expression levels of GlpO were not influenced too much by the concentrations of IPTG (Figure 3A). As the SD-sequence and the spacer sequence are part of the ribosome binding site (RBS), the nucleotide composition of the spacer sequence directly influences the formation and stability of the mRNA-ribosome complex [17,19]. High GC content in the 5’ UTR might form a more stable mRNA secondary structure, which can reduce the translation initiation efficiency as well [25]. Furthermore, since the long spacer sequence resulted in a mismatch of start codon and ribosome, the combination of fMet-tRNA was weakened as well [26]. Therefore, in this work, the addition of the extra CG sequence in the spacer sequence resulted in a low rate of translation initiation, and further reduced expression level.
| Table 1: Purification of recombinant GlpO from 1 L culture. | |||||||
| Crude extract | Proteins purified by Ni-Sepharose | ||||||
| Total protein (mg/L) |
Total activity (U/L) |
Specific activity (U/mg) |
Total protein (mg/L) |
Total activity (U/L) |
Specific activity (U/mg) |
FAD content % |
|
| GlpO-pET | 716.65 | 357.80 | 0.50 | 169.40 | 48.80 | 0.29 | 2.44 |
| GlpO-CG4 | 611.04 | 319.03 | 0.52 | 137.72 | 56.38 | 0.41 | 5.49 |
| GlpO-CG6 | 791.12 | 1156.60 | 1.46 | 61.50 | 515.50 | 8.38 | 65.91 |
| GlpO-pUC | 763.2 | 1202.03 | 1.57 | 35.84 | 363.30 | 10.14 | 77.81 |
The GlpO activity was determined by spectrophotometric assay. As shown in Figure 3B and Table 1, contrary to the expression levels, GlpO expressed by both GlpO-pUC and GlpO-CG6 vectors exhibited higher activity than GlpO-CG4 and GlpO-pET vectors. Comparing expression levels with the activities of all four samples, it was clear that the specific activity of GlpO increased with the decline of the expression level. This suggested that GlpO could be more easily folded properly under the low expression rate. But if the expression rate were reduced to a relatively low level, the total functional expression level would be influenced. Although GlpO-pUC exhibited the maximal specific activity, the production of the enzyme was too low to limit the total functional expression level. Hence, both the expression rate and the expression level should be considered jointly. In our experiments, nucleotide changes to the spacer sequence could provide more precise regulation of protein expression, as the purified enzyme of GlpO-CG6 is about 61.5 mg with a maximal total activity of approximately 515.5 U per liter of LB culture. The total activity of GlpO expressed from the modified vector, GlpO-CG6, was 11 times and 1.5 times higher than that expressed on the GlpO-pET and GlpO-pUC, respectively. This suggests that GlpO-CG6 is the best expression vector to obtain the maximal functional expression of active GlpO. Our results demonstrated that subtle adjustments in the initiation of translation might be a good strategy to balance the expression level and bioactivity of the target enzyme to attain the maximum activity.
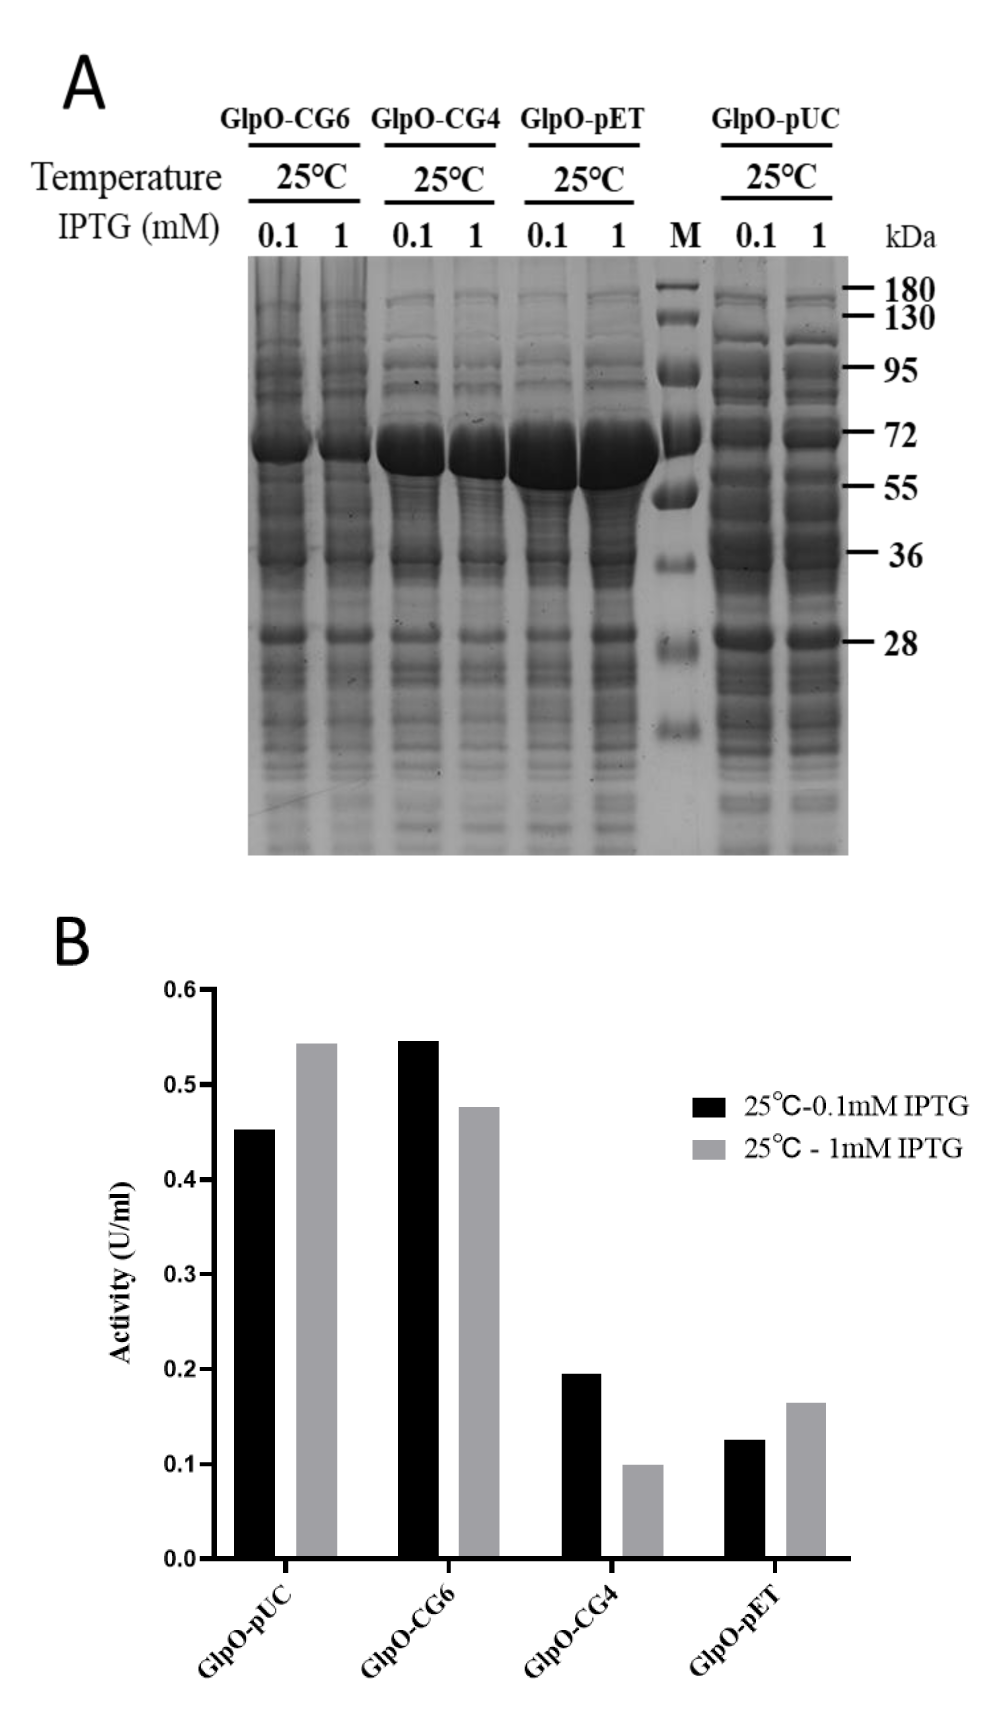
Figure 3: The relationship of expression level and bioactivity of GlpO. A) Expression analysis of GlpO on the different vectors under different conditions. The soluble extract was analyzed by SDS-PAGE after centrifugation. B) The cell pellets from the 5 mL culture were suspended in 600 μL lysis buffer and the soluble fractions were obtained by centrifugation after sonification. The GlpO activity of GlpOs from the soluble cell extracts expressed at 25 °C with 0.1 mM or 1 mM IPTG was analyzed. Standard oxidase assays were carried out with 100 mM α-glycerophosphate.
The relation between FAD content and GlpO bioactivity
In order to explain the differences between GlpO activity in these four samples, the content of FAD on the different GlpOs was determined by the characteristic absorbance of flavoprotein at 450 nm [22]. As shown in Table 1, there was a strong positive correlation between FAD content and activity. The specific activity of GlpO-pUC was approximately 30-fold higher compared with GlpO-pET, and the content of FAD on GlpO-pUC was 30 times higher than in GlpO-pET. Therefore, it was obvious that differences in GlpO activity were due to the different levels of FAD in the GlpOs. When GlpO was expressed at a higher rate, FAD was incompletely attached to the protein. The GlpO protein then tended to fold into a soluble inactive form, resulting in the reduction of specific activity of GlpO.
Under the conditions of high expression rate, FAD was incompletely attached to the GlpO, resulting in the misfolding of GlpO and a loss of GlpO activity. Compared with GlpO expression on a pET plasmid, the expression on the pUC vector resulted in a low yield but greatly increased the specific activity of GlpO. A rate of expression that is too low, however, leads to an undesirable reduction in the yield of the target protein. The expression rate of GlpO could be regulated and controlled by inserting different lengths of GC-rich nucleotide sequences into the spacer sequence. Increasing the GC content and extending the length of the spacer sequence could dramatically reduce the translation rate, and thereby the expression level of GlpO. The newly constructed GlpO-GC6 vector is the best vector to obtain the maximal total functional expression and activity of GlpO. The four vectors, pET, pUC, and the two novel vectors with modified spacer sequences, can regulate protein expression at different rates to meet the requirement of production and activity. It can be expected that these vectors are universal and have great application prospects in controlling the expression rate and activity of other enzymes.
This work was supported by the National Natural Science Foundation of China (Grant No. 31800649) and the Youth Innovation Promotion Association, Chinese Academy of Sciences (Grant No. 2018211). Mr. Gregory Patrick Wolfe is much appreciated for proof reading this paper.
- Maenpuen S, Watthaisong P, Supon P, Sucharitakul J, Parsonage D, Karplus PA, Claiborne A, Chaiyen P. Kinetic mechanism of L-α-glycerophosphate oxidase from Mycoplasma pneumoniae. FEBS J. 2015 Aug;282(16):3043-59. doi: 10.1111/febs.13247. Epub 2015 Mar 20. PMID: 25712468.
- Hames C, Halbedel S, Hoppert M, Frey J, Stülke J. Glycerol metabolism is important for cytotoxicity of Mycoplasma pneumoniae. J Bacteriol. 2009 Feb;191(3):747-53. doi: 10.1128/JB.01103-08. Epub 2008 Nov 21. PMID: 19028882; PMCID: PMC2632104.
- Elkhal CK, Kean KM, Parsonage D, Maenpuen S, Chaiyen P, Claiborne A, Karplus PA. Structure and proposed mechanism of L-α-glycerophosphate oxidase from Mycoplasma pneumoniae. FEBS J. 2015 Aug;282(16):3030-42. doi: 10.1111/febs.13233. Epub 2015 Mar 14. PMID: 25688572.
- Schumacher M, Nicholson P, Stoffel MH, Chandran S, D'Mello A, Ma L, Vashee S, Jores J, Labroussaa F. Evidence for the Cytoplasmic Localization of the L-α-Glycerophosphate Oxidase in Members of the "Mycoplasma mycoides Cluster". Front Microbiol. 2019 Jun 19;10:1344. doi: 10.3389/fmicb.2019.01344. PMID: 31275271; PMCID: PMC6593217.
- Staerck C, Wasselin V, Budin-Verneuil A, Rincé I, Cacaci M, Weigel M, Giraud C, Hain T, Hartke A, Riboulet-Bisson E. Analysis of glycerol and dihydroxyacetone metabolism in Enterococcus faecium. FEMS Microbiol Lett. 2021 May 6;368(8):fnab043. doi: 10.1093/femsle/fnab043. PMID: 33864460.
- Charrier V, Luba J, Parsonage D, Claiborne A. Limited proteolysis as a structural probe of the soluble alpha-glycerophosphate oxidase from Streptococcus sp. Biochemistry. 2000 May 2;39(17):5035-44. doi: 10.1021/bi992499j. PMID: 10819968.
- MacKová M, Kost'Al J, Demnerová K. Properties and stability of glycerophosphate oxidase isolated from a mutant strain of Aerococcus viridans. Lett Appl Microbiol. 2000 Mar;30(3):188-91. doi: 10.1046/j.1472-765x.2000.00690.x. PMID: 10747248.
- Pilo P, Vilei EM, Peterhans E, Bonvin-Klotz L, Stoffel MH, Dobbelaere D, Frey J. A metabolic enzyme as a primary virulence factor of Mycoplasma mycoides subsp. mycoides small colony. J Bacteriol. 2005 Oct;187(19):6824-31. doi: 10.1128/JB.187.19.6824-6831.2005. PMID: 16166545; PMCID: PMC1251598.
- Blötz C, Stülke J. Glycerol metabolism and its implication in virulence in Mycoplasma. FEMS Microbiol Rev. 2017 Sep 1;41(5):640-652. doi: 10.1093/femsre/fux033. PMID: 28961963.
- Nagaraju R, Joshi AK, Rajini PS. Estimation of plasma triglycerides with correction for free glycerol by orlistat inhibition of lipoprotein lipase activity. Anal Biochem. 2013 Aug 1;439(1):44-6. doi: 10.1016/j.ab.2013.04.008. Epub 2013 Apr 15. PMID: 23597845.
- Streitenberger SA, López-Mas JA, Sánchez-Ferrer A, García-Carmona F. Highly efficient Aerococcus viridans L-alpha-glycerophosphate oxidase production in the presence of H2O2-decomposing agent: purification and kinetic characterization. Appl Microbiol Biotechnol. 2001 Oct;57(3):329-33. doi: 10.1007/s002530100664. PMID: 11759680.
- Menzella HG. Comparison of two codon optimization strategies to enhance recombinant protein production in Escherichia coli. Microb Cell Fact. 2011 Mar 3;10:15. doi: 10.1186/1475-2859-10-15. PMID: 21371320; PMCID: PMC3056764.
- Mauro VP. Codon Optimization in the Production of Recombinant Biotherapeutics: Potential Risks and Considerations. BioDrugs. 2018 Feb;32(1):69-81. doi: 10.1007/s40259-018-0261-x. PMID: 29392566.
- Blazeck J, Alper HS. Promoter engineering: recent advances in controlling transcription at the most fundamental level. Biotechnol J. 2013 Jan;8(1):46-58. doi: 10.1002/biot.201200120. Epub 2012 Aug 14. PMID: 22890821.
- Mutalik VK, Guimaraes JC, Cambray G, Lam C, Christoffersen MJ, Mai QA, Tran AB, Paull M, Keasling JD, Arkin AP, Endy D. Precise and reliable gene expression via standard transcription and translation initiation elements. Nat Methods. 2013 Apr;10(4):354-60. doi: 10.1038/nmeth.2404. Epub 2013 Mar 10. PMID: 23474465.
- Cheong DE, Ko KC, Han Y, Jeon HG, Sung BH, Kim GJ, Choi JH, Song JJ. Enhancing functional expression of heterologous proteins through random substitution of genetic codes in the 5' coding region. Biotechnol Bioeng. 2015 Apr;112(4):822-6. doi: 10.1002/bit.25478. Epub 2015 Jan 16. PMID: 25323933.
- Mirzadeh K, Martínez V, Toddo S, Guntur S, Herrgård MJ, Elofsson A, Nørholm MH, Daley DO. Enhanced Protein Production in Escherichia coli by Optimization of Cloning Scars at the Vector-Coding Sequence Junction. ACS Synth Biol. 2015 Sep 18;4(9):959-65. doi: 10.1021/acssynbio.5b00033. Epub 2015 May 15. PMID: 25951437.
- Parret AH, Besir H, Meijers R. Critical reflections on synthetic gene design for recombinant protein expression. Curr Opin Struct Biol. 2016 Jun;38:155-62. doi: 10.1016/j.sbi.2016.07.004. Epub 2016 Jul 21. PMID: 27449695.
- Liebeton K, Lengefeld J, Eck J. The nucleotide composition of the spacer sequence influences the expression yield of heterologously expressed genes in Bacillus subtilis. J Biotechnol. 2014 Dec 10;191:214-20. doi: 10.1016/j.jbiotec.2014.06.027. Epub 2014 Jul 2. PMID: 24997355.
- Wang M, Kaufman RJ. Protein misfolding in the endoplasmic reticulum as a conduit to human disease. Nature. 2016 Jan 21;529(7586):326-35. doi: 10.1038/nature17041. PMID: 26791723.
- Zheng C, Zhao Z, Li Y, Wang L, Su Z. Effect of IPTG amount on apo- and holo- forms of glycerophosphate oxidase expressed in Escherichia coli. Protein Expr Purif. 2011 Feb;75(2):133-7. doi: 10.1016/j.pep.2010.08.009. Epub 2010 Aug 22. PMID: 20736068.
- Savino S, Meijer JDM, Rozeboom HJ, van Beek HL, Fraaije MW. Kinetic and structural properties of a robust bacterial L-amino acid oxidase. Catalysts. 2021; 11: 1309.
- Shilling PJ, Mirzadeh K, Cumming AJ, Widesheim M, Köck Z, Daley DO. Improved designs for pET expression plasmids increase protein production yield in Escherichia coli. Commun Biol. 2020 May 7;3(1):214. doi: 10.1038/s42003-020-0939-8. PMID: 32382055; PMCID: PMC7205610.
- Sibley M, Ward JM. A cell engineering approach to enzyme-based fed-batch fermentation. Microb Cell Fact. 2021 Jul 24;20(1):146. doi: 10.1186/s12934-021-01634-y. PMID: 34303374; PMCID: PMC8310608.
- Tuller T, Zur H. Multiple roles of the coding sequence 5' end in gene expression regulation. Nucleic Acids Res. 2015 Jan;43(1):13-28. doi: 10.1093/nar/gku1313. Epub 2014 Dec 12. PMID: 25505165; PMCID: PMC4288200.
- Wakabayashi H, Warnasooriya C, Ermolenko DN. Extending the Spacing between the Shine-Dalgarno Sequence and P-Site Codon Reduces the Rate of mRNA Translocation. J Mol Biol. 2020 Jul 24;432(16):4612-4622. doi: 10.1016/j.jmb.2020.06.008. Epub 2020 Jun 13. PMID: 32544497; PMCID: PMC7387212.