
More Information
Submitted: May 22, 2023 | Approved: June 09, 2023 | Published: June 12, 2023
How to cite this article: Ting P, Sahu A, Wajge N, Rao V, Poosarla H, et al. Using Model Classification to detect Bias in Hospital Triaging. Ann Biomed Sci Eng. 2023; 7: 024-030.
DOI: 10.29328/journal.abse.1001022
Copyright License: © 2023 Ting P, et al. This is an open access article distributed under the Creative Commons Attribution License, which permits unrestricted use, distribution, and reproduction in any medium, provided the original work is properly cited.
Keywords: Hospital triaging; Medical systemic bias; Patient treatment; Public health; Machine learning

Using Model Classification to detect Bias in Hospital Triaging
Patrick Ting1*, Aayaan Sahu2, Nishad Wajge3, Vineet Rao4, Hiresh Poosarla5 and Phil Mui6
1Johns Hopkins University, USA
2Archbishop Mitty High School, USA
3The University of Maryland, USA
4Prospect High School, USA
5Mission San Jose High School, USA
6Department of Computer Science & Engineering, Aspiring Scholars Directed Research Program, USA
*Address for Correspondence: Patrick Ting, Department of Computer Science & Engineering, Aspiring Scholars Directed Research Program, USA, Email: [email protected]
Background: In light of the COVID-19 pandemic and the health crisis left in its wake, our goal is to develop extensive machine-learning techniques to provide a clear picture of the treatment, and possible mistreatment, of specific patient demographics during hospital triaging.
Objective: We aim to reveal whether a patient’s treatment and hospital disposition is related to the following attributes - Emergency Severity Index (ESI), gender, employment status, insurance status, race, or ethnicity which our 100 MB dataset included.
Materials and methods: Our work is separated into two parts - the classification task and data analysis. As part of the classification task, we used the k-Nearest-Neighbor classifier, the F1-score, and a random forest. We then analyze the data using SHapley Additive exPlanations (SHAP) values to determine the importance of each attribute.
Results: Our findings show that significance varies for each attribute. Notably, we found that patients with private insurance programs receive better treatment compared to patients with federal-run healthcare programs (e.g. Medicaid, Medicare). Furthermore, a patient’s ethnicity has a greater impact on treatment for patients under 40 years of age for any given ESI level. Surprisingly, our findings show language is not a barrier during treatment.
Discussion and conclusion: We, therefore, conclude that although hospitals may not be doing so intentionally, there is a systemic bias in hospital triaging for specific patient demographics. For future works, we hope to aggregate additional patient data from hospitals to find whether specific demographics of patients receive better healthcare in different parts of the United States.
Background and significance
Ever since the advent of hospital triaging, and now prominently within the past few years of the COVID-19 pandemic, bias, implicit or not, has affected how patients of different demographic groups are prioritized for emergency room admissions, medical supplies are concentrated, and more. Understanding the underlying causes of this phenomenon and exactly how this can favor selecting demographics over others is crucial to creating a fair, effective, and beneficial method of triaging patients, especially in underserved communities.
Currently, over 80% of hospitals employ the use of the Emergency Severity Index [1], a five-level triage tool used to help medical practitioners allocate resources. The ESI takes into account acuity (the level of nursing care needed by the patient) and resource needs. Previous studies [2] found that certain minorities receive a higher ESI level (thereby fewer medical resources) than Caucasians, leading to unfair treatment of patients despite the same symptoms. In 2009, the American Hospital Association reported the following survey data in which hospitals reported which triage system they used: ESI (57%), 3-level (25%), 4-level (10%), 5-level systems other than ESI (6%), 2-level or other triage system (1%), no triage (1%) [3].
Problem statement
Within the past few years in the midst of protests, awareness acts, and get-togethers, the demand for decreasing discrimination at all costs has been on the radar. Research has shown individuals of African American descent are 3 times more likely to be victims of police genocide [4]. In addition to racial inequality, other factors such as age, gender, and social status have had a vast prominence against moral standards. In economic standards, women are estimated to be spending twice as much time doing unpaid work compared to men [5], via skewed job selectivity standards. While women comprise nearly half the workforce, they still continue to earn only a fraction compared to that of men. In terms of economic inequality, the wealth gap between America’s richest and poorest households has more than doubled ever since 1989 [6]. We hope to examine this discrimination in the medical field, in a situation where any form of bias could have heavy implications on a patient’s survivability.
Objective
Given the health crisis over the course of the previous 3 years, our aim is to develop and utilize more advanced and thorough techniques within the realm of machine learning to provide a clear picture of the treatment and possible mistreatment of specific demographics of patients in the hospital setting. We will use data analysis to examine the prioritization of certain ethnic groups/communities. Hospital disposition includes how a patient is likely to be directed or advised in the hospital setting. We aim to reveal whether or not one’s treatment and hospital disposition (including admission and discharge rate) shows bias connected with one’s racial ethnicity, gender, sex, employment or insurance status, or age.
Previous studies such as that of Jacob M. Vigil, et al. utilize statistical techniques on collected pain intensity rating, which revealed that African Americans and Latino Americans displayed a much higher degree of pain inflicted by their diseases than their Caucasian counterparts in the same level of prioritization in Emergency Room admittances [7].
According to a review article written by Anke Samulowitz et. al, physicians were more likely to be dismissive of chronic, long-term pain that was reported by female patients than that from male patients.
The authors speculate that this has contributed to environments that fostered miscommunication and decreased trust between physicians and female patients [8]. Furthermore, based on a review article by Woo Suk et al., the overall hospital admission risk was 29.7% and decreased by triage level. ED visits were filtered for exclusion criteria to yield 560,486 records, 13% of which were excluded due to dispositions other than admission and discharge [9]. Additionally, a study by Chet D. Schrader and Lawrence M. Lewis concluded that African Americans were subject to longer wait times than their Caucasian counterparts in the emergency department [10]. Finally, a paper by Cynthia Arslanian-Engoren finds that age and gender can play a role in triage decisions. It hypothesizes that factors such as “nursing knowledge and experience, practice environment, intuition, the fear of liability, and gender-specific behaviors” may play a role in the evaluation, treatment, and decisions made by ED nurses during the triaging process [11].
Data preprocessing
We utilized a dataset obtained from Kaggle [12] which consisted of de-identified patient data at a triage facility. Each patient had 972 features associated with them. Among the most significant were: “ESI”, “Age”, “Gender”, “Ethnicity”, “Race”, “Employment Status”, and “Insurance Status”. Since we only focused on these factors a limitation we had was that other factors could also be impactful. We condensed the original dataset to include the features described above in addition to some others we found notable. In order to prevent creating any data points artificially, we excluded any patients that contained a null value for any feature.
The majority of the dataset was composed of Caucasian patients, who made up about 53% of the dataset, while Native Hawaiian or Other Pacific Islander patients made up only about 0.066% of the dataset (Figure 1).
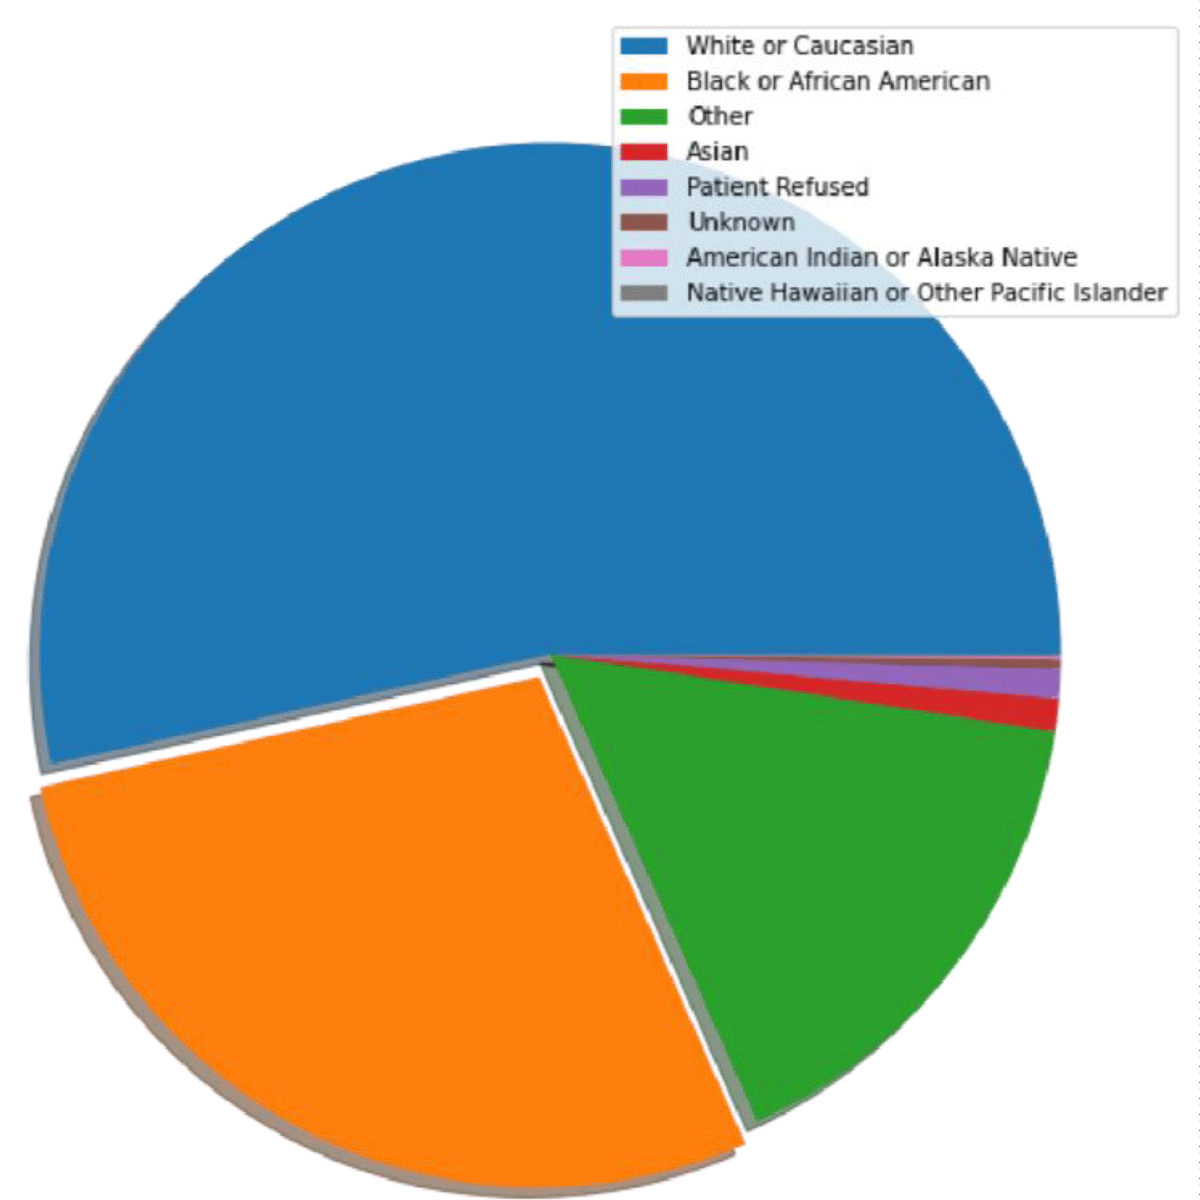
Figure 1: A pie chart displaying race distribution from the dataset.
We then trained models that could predict whether or not a patient is admitted to a hospital. Subsequently, we incorporated SHAP [13] values to interpret which features the model prioritized when making a prediction. A limitation with SHAP was that it is normally not used for casual inference which is similar to what we did here discovering bias.
[https://towardsdatascience.com/the-limitations-of-shap-703f34061d86].
Training
We trained a k-Nearest-Neighbors (KNN) classifier [14], a decision tree classifier [15], and a random forest classifier [16], with their corresponding F1 scores and model accuracies displayed in Table 1. The main reason on why we decided to use the KNN classifier is that it does not require training data.
| Table 1: This table displays the respective F1 scores and Accuracies of 3 Machine learning algorithms. | ||
| F1 | Accuracy | |
| Random forest | 0.714 | 0.763 |
| Decision Tree | 0.698 | 0.698 |
| kNN | 0.696 | 0.751 |
[https://machinelearninginterview.com/topics/machine-learning/how-does-knn-algorithm-work-what-are-the-advantages-and-disadvantages-of-knn/].
F1-score
The F1-score [17] is used to evaluate models based on their predictions. It is defined as the harmonic mean between precision and recall. Precision is defined as the number of true positives a model predicts divided by the total number of positives the model predicts, and recall is defined as the number of true positives the model predicted divided by all samples that should have been predicted positive.
Based on the definition of harmonic mean the equation of the F1-score is:
Random forest
Random forest is a machine learning algorithm within the category of ensemble learning [18] which makes use of multiple decision trees, each weaker than the entire classifier, along with bootstrapping [19], where individual trees get smaller datasets via sampling from the original dataset, and feature randomness, where each tree gets a randomly selected subset of features to train on. The random forest algorithm takes the predictions from its decision trees and performs a majority vote, outputting a final prediction. Due to this process being conducted on a variety of uncorrelated decision trees, random forest algorithms tend to perform better than stand-alone decision tree algorithms. Moreover, it is more resistant to outliers, and its architecture corrects for decision trees’ tendency to overfit data. We decided to go with this model as it is more accurate than other models such as decision trees and also has more complex visualization [https://www.analyticsvidhya.com/blog/2020/05/decision-tree-vs-random-forest-algorithm/#:~:text=The%20random%20forest%20has%20complex,is%20more%20accurate%20in%20predictions.].
Shap values
Shap Values [20] is an algorithm that identifies features with the highest importance in machine learning models [21] to provide greater transparency as to which factor carried the greatest weight in overall result determination. For our purposes, we implemented Shap Values on the previously detailed Random Classification Algorithm to identify which pieces of information provided by the patient influenced the hospital triaging system the greatest.
Dataset slicing and manipulation
To test the effects of a patient’s sex on hospital triaging, we split our main dataset into one containing the data of only male patients, and the other containing the data of only female patients.
With regards to assessing the impact of a given patient’s employment status on their hospital disposition, we split the main dataset into four categories of employment: ‘Full Time’, ‘Unemployed’, ‘Part Time’, ‘Retired’.
Additionally, to examine the impact of one’s insurance status on their disposition within the hospital setting, we split the main dataset into one containing data from patients utilizing the Medicaid insurance program and one containing data from patients who have access to private insurance to assist with covering their medical costs.
We also considered the impact of a given patient’s English-speaking ability on their disposition within the hospital setting by splitting the main dataset into one containing data belonging to patients whose main language was English and one containing data belonging to patients whose main language was not English.
The ages in the dataset ranged from 18 to 108. We defined four age groups that we assigned patients: “18 to 24”, “25 to 39”, “40 to 64”, and “65 plus”. We divided the dataset into smaller datasets that contained every combination of ESI value and age range.
With regards to dividing our dataset into its training, testing, and validating counterparts, we adhered to an 80%, 10%, and 10% split proportion to the train, test, and validate our model, respectively.
To address the potential overrepresentation of Caucasian patients and the potential underrepresentation of other minority ethnicities, we considered the implementation of a Balanced Random Classifier (BRC). However, we found vastly more consistent and accurate results with the Random forest classifier when compared to the BRC.
Shap value implementation
We then ran a SHAP analysis on each one of these datasets to see which features played the biggest role in the model’s decision for each category.
As displayed in Figure 2, compared to females, males’ age has a greater impact on admission into hospitals. In addition, for men, the method of transportation (arrival mode) had a greater effect on hospital admission than insurance status. While women’s insurance status influenced admission to a hospital more than their mode of transportation (arrival mode).
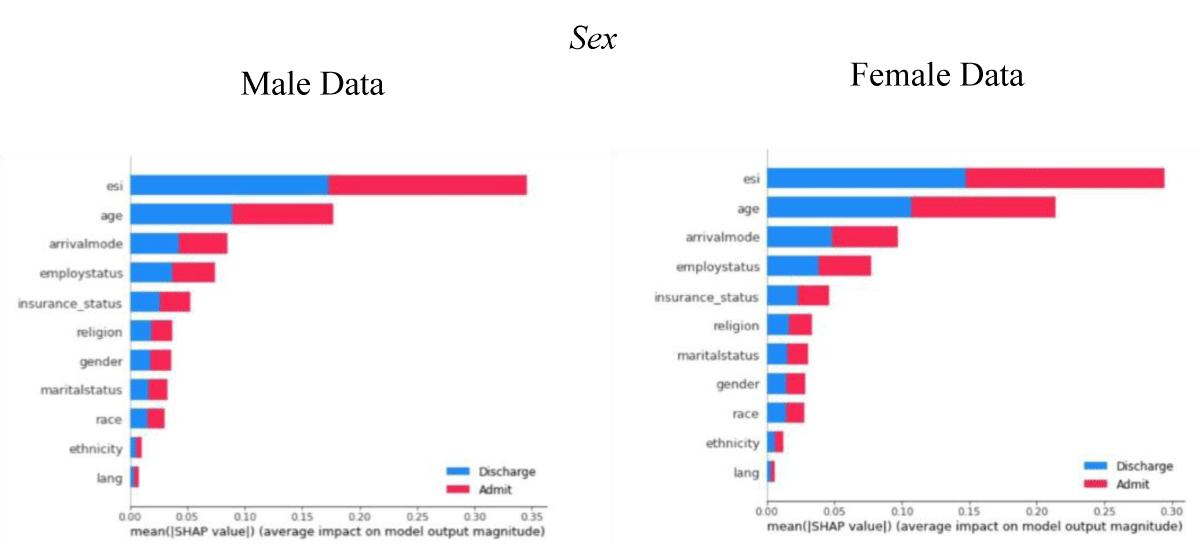
Figure 2: Comparison of gender using 500 samples (SHAP).
Employment status
As depicted by Figure 3, for full-time employees, their employment status was the third most considered factor; however, for the unemployed patients, their employment status was the 5th most considered factor, meaning that for the employed patients, our model took the fact that they were employed more into consideration. In addition, for the unemployed patients, their race had more weight when the model made its decision compared to the full-time patients. More specifically, for unemployed patients, the model ranked their race as the 6th most important factor, while for the full-time patients, the model ranked their race as the 8th most important factor.
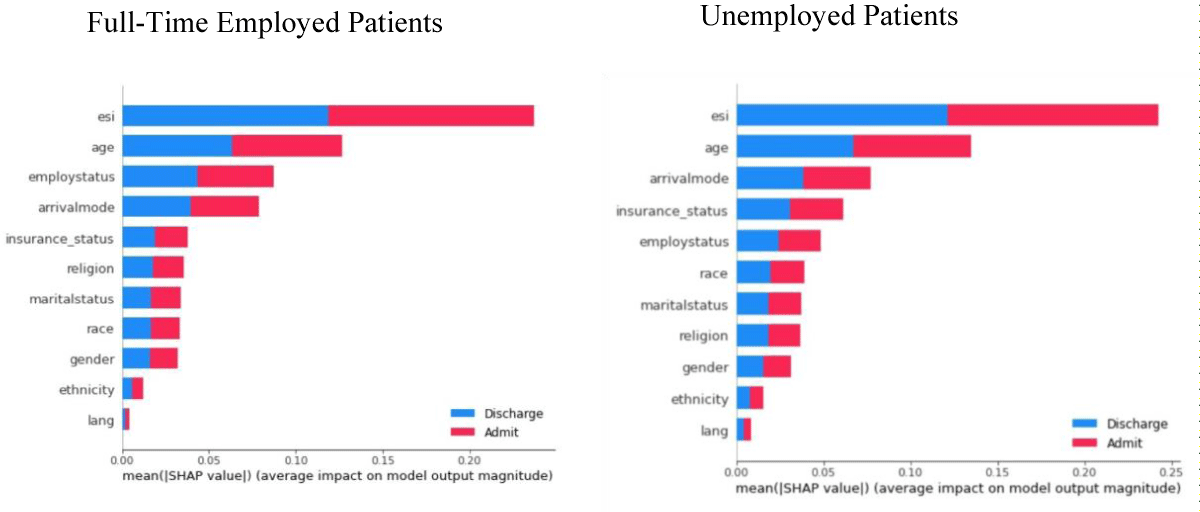
Figure 3: Comparison of employment status using 500 samples (SHAP).
Insurance status
For patients with private insurance, their insurance status was the most important factor, even toppling ESI, that the model considered when making a prediction for a patient, suggesting that hospitals mainly consider a person’s ability to pay for people capable of paying for their own medical treatment in the patient’s admission or discharge, as shown by Figure 4.
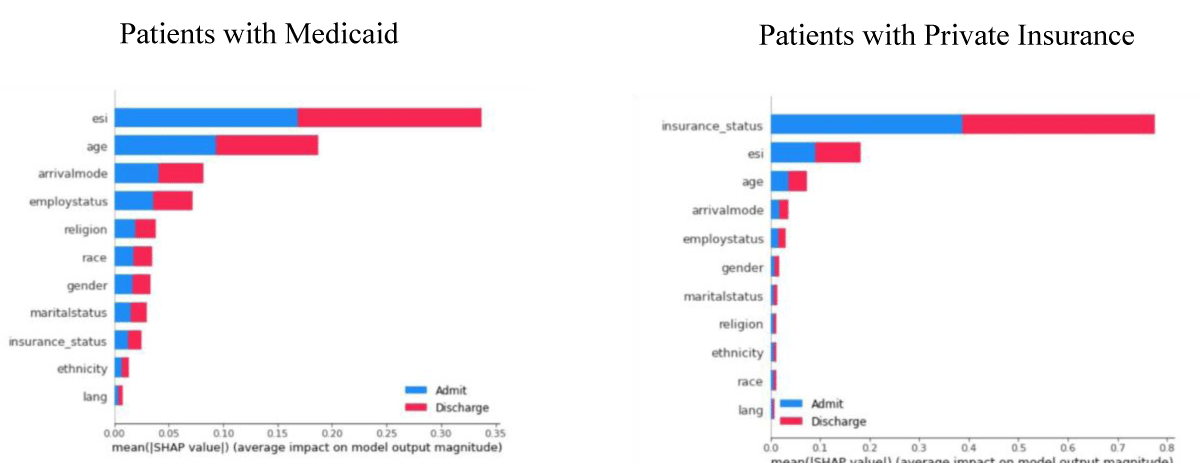
Figure 4: Comparison of insurance status using 500 samples (SHAP).
English speaking ability
As shown by Figure 5, our model essentially did not consider a patient’s English speaking ability and fluency in determining the patient’s rank in the hospital triaging system.
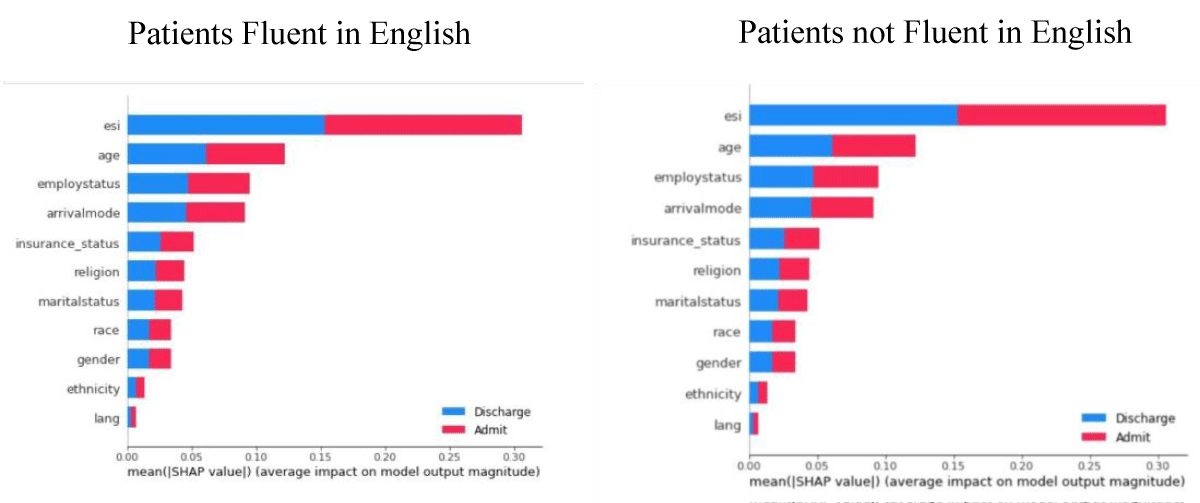
Figure 5: Comparison of English-speaking ability using 500 samples (SHAP).
Grouping by Age & ESI
A patient with an ESI 1 is classified as a patient that needs immediate, life-saving interventions [22]. Based on the computations by the SHAP analysis, we can see that, when given a patient with an ESI of 1, the model prioritizes, for the most part, their ESI, their age, their arrival mode, their insurance status, and their employment status. When looking at how the model prioritizes the race of a patient, Figure 6 illustrates that race is more prioritized for the age range of 18-39, but not by that big of a margin.
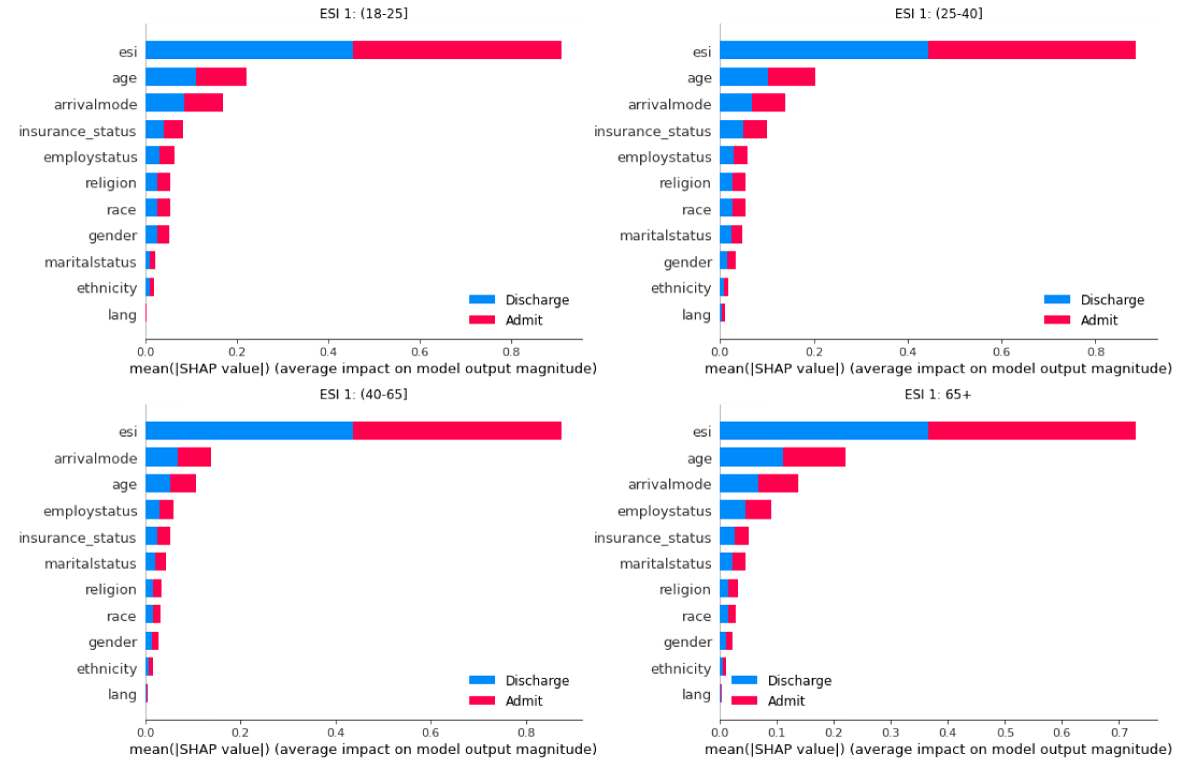
Figure 6: Feature importance of data containing ES1=1 patients across 4 age groups using 200 samples.
From our data, we found a severe correlation amongst several of our tested factors of the patient’s Sex, Employment Status, Insurance Status, and Age and disposition within the hospital theatre. One notable factor that did not yield a significant difference in its impact on the hospital triage system was English Speaking Ability. This may be in part due to enhanced technological capabilities or reduced language barriers as a result of personalized healthcare providers. Either way, this signals that potential language barriers can easily be overcome with virtually no effect on a patient’s likelihood of or timing for being admitted or discharged from a hospital.
However, analysis with SHAP values yielded that the factors of Sex, Insurance Status, Age, and ESI [23] carried heavy weight in the process of Hospital Triaging. To summarize our results, Males were likely prioritized over female patients. Patients with private insurance or who could pay out of pocket for their medical costs were prioritized greatly over those reliant on Medicaid Insurance. And for patients under 40, race was a more significant factor for Hospitals in determining their triage placement than for patients above the age of 40 normalized for the same level of Emergency Severity Index. Overall, our data suggest that, over the past 8 years, implicit bias against certain patient demographic groups is very much prevalent in the American medical system, which points toward future measures that should be taken to curb the effects of medical systematic bias. Given the increasing relevance of more machine learning-based applications and tools within the scope of the medical field, it is important to address the fact that faulty training of machines is influential in the decision-making process of hospital priority to ensure the integrity of healthcare equity in the US.
Future works
The future steps that should be taken in our research would include further identifying more groups of bias. In the future, we would hope to conclude our studies and find more examples of bias in the dataset. We also hope to find a data set that is more recent so we could continue with our analysis to see if anything has changed in the past few years. Along with continuing our study, we would like to continue to find bias in other sections including but not limited to race.
We believe that the same implicit bias against certain social groups or demographics evident in hospital triaging systems reflects the similar causes for the rise of police brutality, which is largely driven by data of certain racial groups as it pertains to crime rates. Similarly, as hospital triaging softwares are algorithms based purely on past data and records, it is expected that there should exist some sort of skewness in prioritization programs in deciding which patients to admit or discharge next. In addition, to address this issue, government action may be required to help guarantee equal access to medical facilities to all individuals and citizens to foster the development of more representative hospital datasets, the training grounds of our current and future healthcare-assisting machine learning algorithms.
Data availability
The source code for this project, as well as links for our trained models and dataset, are available at https://github.com/pting302/AI_for_Bias_Detection_Healthcare.
Author contribution statement
P.T. and A.S. developed and implemented the machine learning Architectures and subsequent transparency algorithms. P.T. analyzed the results. All authors wrote and reviewed the manuscript.
- Silva JAD, Emi AS, Leão ER, Lopes MCBT, Okuno MFP, Batista REA. Emergency Severity Index: accuracy in risk classification. Einstein (Sao Paulo). 2017 Oct-Dec;15(4):421-427. doi: 10.1590/S1679-45082017AO3964. PMID: 29364364; PMCID: PMC5875154.
- Paulus JK, Kent DM. Predictably unequal: understanding and addressing concerns that algorithmic clinical prediction may increase health disparities. NPJ Digit Med. 2020 Jul 30;3:99. doi: 10.1038/s41746-020-0304-9. PMID: 32821854; PMCID: PMC7393367.
- McHugh M, Tanabe P, McClelland M, Khare RK. More patients are triaged using the Emergency Severity Index than any other triage acuity system in the United States. Acad Emerg Med. 2012 Jan;19(1):106-9. doi: 10.1111/j.1553-2712.2011.01240.x. Epub 2011 Dec 23. PMID: 22211429.
- Jahn, Jaquelyn, and Gabriel Schwartz. “Black People More than Three Times as Likely as White People to Be Killed during a Police Encounter.” News, 8 July 2020, https://www.hsph.harvard.edu/news/hsph-in-the-news/blacks-whites-police-deaths-disparity.
- Gaëlle F. Unpaid Care Work: The Missing Link in the Analysis of Gender ... OECD. Unpaid Care Work: The Missing Link in the Analysis of Gender Gaps in Labour Outcomes, Dec. 2014. https://www.oecd.org/dev/development-gender/Unpaid_care_work.pdf.
- Katherine S. 6 Facts about Economic Inequality in the U.S. Pew Research Center, Pew Research Center, 27 May 2021. https://www.pewresearch.org/fact-tank/2020/02/07/6-facts-about-economic-inequality-in-the-u-s.
- Vigil JM, Coulombe P, Alcock J, Kruger E, Stith SS, Strenth C, Parshall M, Cichowski SB. Patient Ethnicity Affects Triage Assessments and Patient Prioritization in U.S. Department of Veterans Affairs Emergency Departments. Medicine (Baltimore). 2016 Apr;95(14):e3191. doi: 10.1097/MD.0000000000003191. PMID: 27057847; PMCID: PMC4998763.
- Samulowitz A, Gremyr I, Eriksson E, Hensing G. "Brave Men" and "Emotional Women": A Theory-Guided Literature Review on Gender Bias in Health Care and Gendered Norms towards Patients with Chronic Pain. Pain Res Manag. 2018 Feb 25;2018:6358624. doi: 10.1155/2018/6358624. PMID: 29682130; PMCID: PMC5845507.
- Hong WS, Haimovich AD, Taylor RA. Predicting hospital admission at emergency department triage using machine learning. PLoS One. 2018 Jul 20;13(7):e0201016. doi: 10.1371/journal.pone.0201016. PMID: 30028888; PMCID: PMC6054406.
- Chet SD. Racial Disparity in Emergency Department Triage. 23 June 2012. https://www.jem-journal.com/.
- Arslanian-Engoren C. Gender and age bias in triage decisions. J Emerg Nurs. 2000 Apr;26(2):117-24. doi: 10.1016/s0099-1767(00)90053-9. PMID: 10748383.
- Ma'alona M. Hospital Triage and Patient History Data. Kaggle. 3 June 2019, https://www.kaggle.com/datasets/maalona/hospital-triage-and-patient-history-data.
- Lundberg SM, Erion G, Chen H, DeGrave A, Prutkin JM, Nair B, Katz R, Himmelfarb J, Bansal N, Lee SI. From Local Explanations to Global Understanding with Explainable AI for Trees. Nat Mach Intell. 2020 Jan;2(1):56-67. doi: 10.1038/s42256-019-0138-9. Epub 2020 Jan 17. PMID: 32607472; PMCID: PMC7326367.
- Padraig C, Sarah D. k-Nearest neighbour classifiers. Mult Classif Syst. 2007; 54:10.1145/3459665.
- Li Y, Dong M, Kothari R. Classifiability-based omnivariate decision trees. IEEE Trans Neural Netw. 2005 Nov;16(6):1547-60. doi: 10.1109/TNN.2005.852864. PMID: 16342495.
- Leo B. Abstract - University of California, Berkeley. RANDOM FORESTS--RANDOM FEATURES, Sept. 1999. https://www.stat.berkeley.edu/~breiman/random-forests.pdf.
- Zachary Chase L. Thresholding Classifiers to Maximize F1 Score. ArXiv.org. 14 May 2014. https://arxiv.org/abs/1402.1892
- Thomas DG. Ensemble Learning. CSE446: Machine Learning. 4 Sept. 2002. https://courses.cs.washington.edu/courses/cse446/.
- Tim H. 2011 - Wires Computational Statistics - Wiley Online Library. Bootstrap. 3 Sept. 2011. https://wires.onlinelibrary.wiley.com/doi/abs/10.1002/wics.182.
- Katsuya F. Pairwise AcquisitioData Science, Elsevier. 9 Mar 2021. https://www.sciencedirect.com/science/article/pii/S24059n Prediction with Shap Value Interpretation.” The Journal of Finance and 18821000015.
- Vinícius T. Using Shap Values to Explain How Your Machine Learning Model Works. Medium, TowardsDataScience, 5 July 2022. https://towardsdatascience.com/using-shap-values-to-explain-how-your-machine-learning-modelworks-732b3f40e137.
- Prateek J. Bootstrap Sampling: Bootstrap Sampling in Machine Learning. Analytics Vidhya. 21 July 2022. https://www.analyticsvidhya.com/blog/2020/02/what-is-bootstrap-sampling-in-statistics-and-mac hine-learning/.
- Shelton R. The Emergency Severity Index 5-level triage system. Dimens Crit Care Nurs. 2009 Jan-Feb;28(1):9-12. doi: 10.1097/01.DCC.0000325106.28851.89. PMID: 19104244.