
More Information
Submitted: October 17, 2023 | Approved: November 02, 2023 | Published: November 03, 2023
How to cite this article: Carmona C, Castrillón M, Nieto JF, Zuluaga G, Arias LF, et al. Gene Expression and Functional Analysis in Patients with Acute and Chronic Renal Allograft Rejection. Ann Biomed Sci Eng. 2023; 7: 051-063.
DOI: 10.29328/journal.abse.1001025
Copyright License: © 2023 Carmona C, et al. This is an open access article distributed under the Creative Commons Attribution License, which permits unrestricted use, distribution, and reproduction in any medium, provided the original work is properly cited.
Keywords: Kidney allograft; Allograft rejection; RNA-Seq; Gene expression; Biomarkers

Gene Expression and Functional Analysis in Patients with Acute and Chronic Renal Allograft Rejection
Carlos Carmona1* , Marlon Castrillón1, John Fredy Nieto2, Gustavo Zuluaga2, Luis Fernando Arias3 and Cristian Álvarez1
1Cellular Immunology and Immunogenetics Group, Faculty of Medicine, University of Antioquia, Medellín, Colombia
2Department of Nephrology, Pablo Tobón Uribe Hospital, Medellín, Colombia
3Department of Pathology, Faculty of Medicine, University of Antioquia, Medellín, Colombia
*Address for Correspondence: Carlos Carmona, Cellular Immunology and Immunogenetics Group, Faculty of Medicine, University of Antioquia, Medellín, Colombia, Email: [email protected]
Kidney transplantation is the therapy of choice for patients with end-stage kidney disease (ESKD). Nevertheless, the main limitation for long-term graft survival is immune-mediated rejection. Some authors have proposed that differences in immune effector mechanisms are influenced by underlying molecular mechanisms; thereby, the identification of differentially expressed genes in acute or chronic rejection in non-invasive samples such as urine may be essential for the identification of potential biomarkers and biological processes associated with allograft outcomes. Our aim was to explore differences in gene expression and functional categories associated with acute and chronic kidney rejection in blood, biopsy, and urine of kidney transplant patients using RNA-Seq. RNA was isolated and sequenced implementing standard protocols. Analyses were addressed to identify differentially expressed genes (DEGs) and Functional Categories of Gene Ontology comparing between samples. Then we focused on immune genes and pathways to identify their association with the allograft. We identified a significant transcriptional similarity between biopsy and urine, in comparison with blood in acute and chronic rejection. Functional analyses suggested an enrichment of immune processes such as antigen processing and presentation, and regulation of B cell receptor signaling pathway in blood of acute and chronic rejection, respectively. Additionally, we observed an increase in expression of chemokines in biopsy and urine of both outcomes along with an increase in chemokine receptors in blood. Our findings suggest that urine is suitable for identifying potential biomarkers and biological processes related to renal allograft rejection, as it shares a significant number of regulated genes with biopsy.
Kidney transplantation is the treatment of choice for patients with end-stage renal disease (ESRD). Transplantation and dialysis are replacement therapies for patients with ESRD; however, transplantation is considered a superior therapeutic approach for improving patients’ quality of life. According to the World Health Organization, the number of patients with ESRD who required a renal allograft in the United States reached 138,844 [1]. In Colombia, between 2020 and 2021, 154,688 new patients with ESRD requiring renal transplantation were registered, showing an increase of 39,249 cases compared to the period 2019 – 2020.
Despite the utility of kidney transplantation as replacement therapy, long-term graft survival is a major challenge for transplant immunology. Some limitations to achieving this goal include graft loss due to recurrent disease, chronic inflammation, hypertension, and other medical comorbidities, damage from calcineurin inhibitor toxicity, medication noncompliance, increasing rates of diabetes, and high rates of premature death ) [2]. Rejection is an immune-mediated process triggered after transplantation because the graft is a major source of alloantigens and inflammatory mediators [3]. Alloantigens include peptides derived from the human leukocyte antigen (HLA) system that can activate the recipient’s innate and adaptive immune responses. Inflammatory mediators arise from mechanical cell damage caused by organ removal, ischemia-reperfusion injury (IRI), and blood recirculation after surgical anastomosis [4,5]. Alloantigens and damage-associated molecular patterns (DAMPs) activate antigen-presenting cells (APCs). Activated APCs present donor HLA-derived peptides to recipient T cells through direct, indirect, and semidirect allorecognition pathways [6,7]. Allorecognition triggers an adaptive immune response against the grafted kidney, mediated by alloreactive effector T cells that infiltrate the transplant and by alloantibodies that, once deposited in the grafted organ, can activate the complement lytic pathway [8]. The immune response requires mobilizing immune effector cells from the recipient’s bloodstream to the renal allograft through an activated endothelium as well as activation of effector cells [9,10]. To counteract the immune response against the renal allograft and help maintain kidney function and integrity, donor-recipient matching is ensured before transplantation, and recipients are given induction therapy at the time of transplantation, as well as maintenance immunomodulatory therapeutics after allografting [11,12].
Nowadays, the immunological mechanisms mediating allograft rejection are better understood, and improved immunomodulatory therapies are available. However, some molecular processes underlying allograft rejection remain to be clearly understood. These processes vary significantly from patient to patient, and some authors have attributed such variability to their likely relationship to molecular regulatory mechanisms that ultimately influence cellular metabolism [13,14].
Renal allograft biopsy remains the gold standard for diagnosing and confirming rejection [15] and identifying the effector mechanism involved, whether T cell-mediated (TCMR) or antibody-mediated (ABMR). However, renal biopsy collection is an invasive procedure that can adversely affect the graft and the patient [16]. Therefore, other biological matrixes, such as urine, have been propose as noninvasive sources of protein or RNA transcripts to determine the allograft status [16-18]. Notwithstanding, the isolation of these molecules from urinary sediment has been limited by their high degradation rate, especially for RNA [19].
The present study explored the molecular mechanisms involved in renal allograft rejection by transcriptomic profiling of peripheral blood, renal biopsy, and urine samples from patients with acute (AcR) and chronic (ChR) renal allograft rejection. These biological matrixes were chosen because peripheral blood transports immune molecules and effector cells to the graft, renal biopsies represent the target tissue of the recipient’s immune response, and urine may contain RNA transcripts reflecting gene expression in the transplanted organ. Transcriptome profiles were determined by next-generation RNA sequencing (RNA-Seq), and data were subjected to an intra-outcome analysis to i) identify differences in gene expression in peripheral blood, renal biopsy, and urine samples in cases of AcR and ChR; ii) establish the level of agreement between gene expression in renal biopsy and urine samples in cases of AcR and ChR; and, iii) categorize genes expressed in blood samples and those expressed simultaneously in renal biopsy and urine samples according to their enrichment of biological processes associated with AcR and ChR.
Patients
This study included patients with acute (AcR, n = 4) and chronic (ChR, n = 3) renal allograft rejection attended at the Renal Unit of the Pablo Tobón Uribe Hospital in Medellín, Colombia. All patients were of legal age, did not suffer from infections at the time of sample collection, agreed to participate voluntarily in the study, and signed the informed consent form, approved by the Ethics Committee of the Medical Research Institute of the Faculty of Medicine of the University of Antioquia. Blood, urine, and renal biopsy samples were taken at the time of allograft rejection. Patient demographic information is summarized in Table 1.
| Table 1: Demographic and clinical characteristics of patients. | |||
| Variable | Type of renal allograft rejection | ||
| Acute (n = 4) |
Chronic (n = 3) |
||
| Age* years | 39 (29 – 42) | 42 (25 – 46) | |
| Sex | F | 0 | 3 |
| M | 4 | 0 | |
| Years post-transplantation* | 4.5 (1 – 11) | 10 (5 – 23) | |
| HLA-ABDR mismatches* | 4 (4 – 5) | 4 (3 – 4) | |
| Immunosuppression | P/C/S | 1 | NA |
| T/M | 2 | NA | |
| P/T | 1 | NA | |
| T/P/M | NA | 3 | |
| P: Prednisolone; C: Cyclosporine; S: Sirolimus; T: Tacrolimus; M: Mycophenolate mofetil. (*): data are expressed as median and range. | |||
Samples
Peripheral blood: EDTA-anticoagulated whole blood samples (4 mL) were drawn from patients at the time of biopsy collection.
Renal biopsy: Renal biopsies (four tissue cylinders) were taken from patients, following the clinical protocols of the Pablo Tobón Uribe Hospital. Two tissue cylinders were immediately placed in 1 mL of TriReagent (#93289, Sigma-Aldrich) and transported in liquid nitrogen to the laboratory for RNA isolation and library preparation for Next Generation Sequencing (NGS). Histopathological results of two representative biopsies are shown in Figure 1.
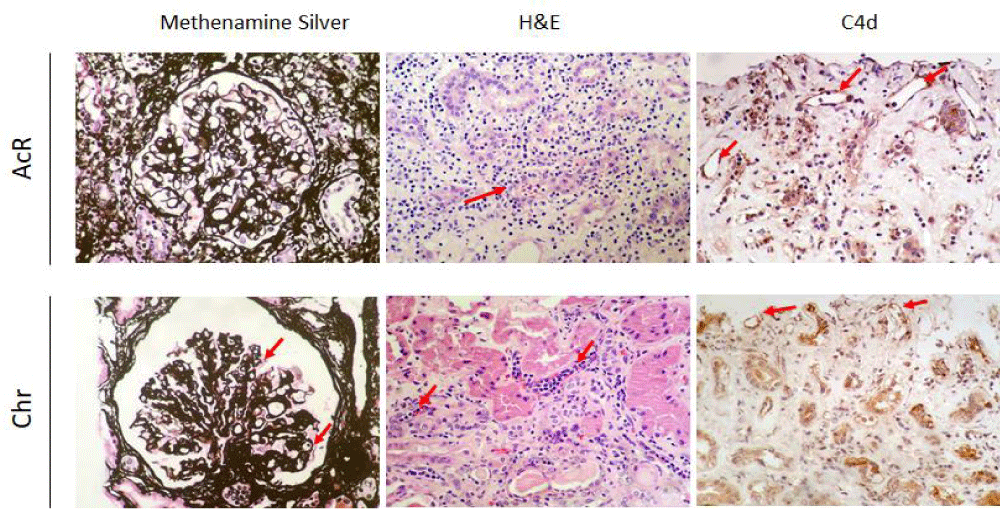
Figure 1: Renal histopathological findings. Renal biopsies were taken from patients with acute (AcR) and chronic (ChR) renal allograft rejection and stained with methenamine silver (400X) and hematoxylin and eosin (H&E) (400X), and immunostained for complement fragment C4d (400X). AcR. Methenamine silver staining shows lymphocytic infiltration of the tubular epithelium, suggesting tubulitis, indicative of T cell-mediated rejection. H&E staining shows a dense T-cell inflammatory infiltrate of the renal cortex, tubulitis, and inflammatory destruction of some tubules (red arrow) with a Banff lesion score of t3. Complement fragment C4d deposits are observed in some peritubular capillaries. ChR. Methenamine silver staining shows a glomerulus with capillary wall thickening and wrinkling and displaying some double contours (red arrows) consistent with chronic graft glomerulopathy resulting from antibody-mediated rejection. H&E staining shows noticeable peritubular capillaritis. Complement fragment C4d deposits are observed within the capillary endothelia.
Urine: Urine samples (200 mL) were collected under aseptic conditions in 50 mL conical tubes pretreated with an RNase inhibitor solution. Samples were placed in liquid nitrogen and immediately transported to the laboratory for further processing.
RNA isolation, quantification and integrity assessment
RNA was isolated from peripheral blood, renal biopsy, and urine samples as described below.
Peripheral blood: An aliquot of the blood sample (about 1.5 mL), containing about 16 x 106 leukocytes, was mixed (1:5) with Buffer EL (#79217, Qiagen), vortexed vigorously for 20 s, and centrifuged at 400 x g for 10 min at 4 °C. After, the supernatant was discarded, and the pellet was homogenized in EL Buffer (1:2) and centrifuged again at 400 x g for 10 min at 4 °C. The pellet was resuspended in 1 mL of Tri Reagent and vortexed until complete cell lysis.
Renal biopsy: Renal allograft biopsies were completely disaggregated in TriReagent using a rotary homogenizer (Biobase BK-HG Series, China) at 8000 rpm at 4 ºC. The whole tissue homogenate was transferred to a new 1.5 mL tube and centrifuged at 12,000 rpm to remove cell debris. The supernatant was then recovered and transferred to a new 1.5 mL tube.
Urine: Urine samples were centrifuged at 3000 x g for 30 min at 4 °C. The pellet (~200 µL) was suspended in 1 mL of TriReagent and vortexed until complete lysis.
Total RNA was extracted as follows. Sample-derived lysates were mixed with 200 µL of chloroform and 2 µL glycogen (#R0551, Thermo Scientific) and incubated at room temperature for 3 min. Each tube was then vortexed for 15 s and centrifuged at 12,000 x g for 15 min at 4 °C. After, the aqueous phase was transferred to a 1.5 mL tube and mixed with an equal volume of prechilled absolute isopropanol and 100 µL of 3 M sodium acetate (pH = 5.2) (Thermo Scientific), incubated at –20 °C for 30 min, and centrifuged at 12,000 x g for 15 min. The supernatant was discarded, and the pellet was washed with 1 mL of 70% ethanol and centrifugation at 10,000 x g for 10 min. After removing the supernatant, the RNA was resuspended in 50 µL of nuclease-free water and deep-frozen until analysis.
Library preparation and sequencing
RNA integrity was assessed using the DV200 index, i.e., the percentage of transcripts with a size equal to or greater than 200 nt. Measures were made using the 4200 TapeStation (Agilent). The cDNA libraries were generated from 200 ng of total RNA at Macrogen Inc., Seoul, South Korea using the SureSelectXT RNA Direct Kit (#G7564A, Agilent) following the manufacturer’s instructions. 150 bp paired-end sequencing of the cDNA fragments in the libraries was carried out at Macrogen Inc. on the NovaSeq6000 system (Illumina). Sequencing quality was assessed by total reads, GC-content percentage (GC%), and a Phred quality Q score of 30 (Q30).
Data analyses and statistics
The methodology used for data analysis is summarized in Figure 2. Briefly, raw data were mapped against the human reference genome assembly GRCh38/hg38 using the Spliced Transcripts Alignment to a Reference (STAR) software [20]. This tool was also used for data cleaning. The raw counts resulting from mapping were used to construct a of raw counts for each gene in each sequenced library. This table was the input for differential gene expression analysis.
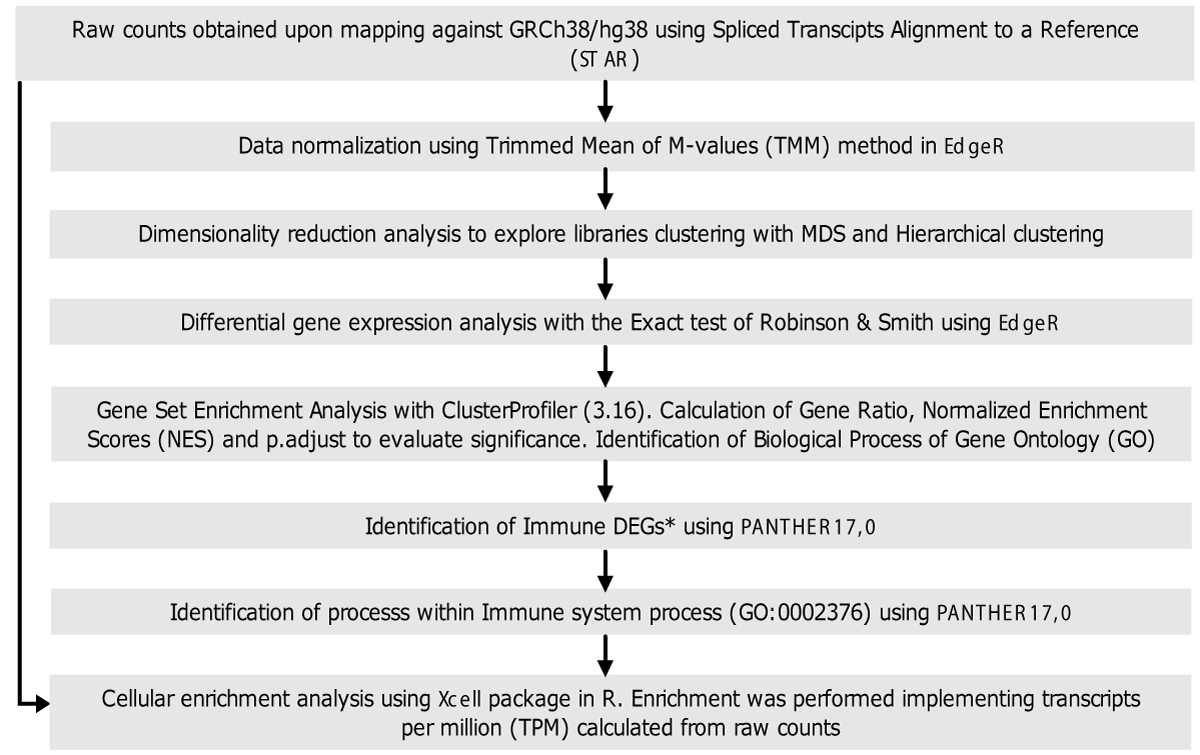
Figure 2: Flow diagram of data analysis. General methodology followed for library screening, differential gene expression analysis, functional analysis, and cell enrichment analysis. *Genes annotated in the immune system process Gene Ontology Term (GO: 0002376) were named immune genes.
Analyses were done in R using the EdgeR in RStudio software package [21]. Initially, gene annotations were done using BiomaRt [22] to obtain gene SYMBOLS, biotypes, and descriptions. After, the data table was formatted as required, and counts per million (CPM) were calculated; data with counts lower than 0.5 were discarded. A preliminary screening of 200 genes showing the highest variability was then carried out using multidimensional scaling (MDS) and hierarchical clustering (HC) approaches. The data were normalized using the calcNormFactors function and the trimmed mean M-value (TMM) approach. A table of normalized counts was constructed for further analysis.
Differential gene expression analysis
Differentially expressed genes (DEGs) were determined by the Robinson and Smyth exact test with a biological coefficient of variation (BCV) of 0.4. Pairwise comparisons (renal biopsy vs. blood, urine vs. blood, blood vs. renal biopsy, and blood vs. urine) were done for the AcR and ChR groups (Figure 3A). To control de false discovery rate (FDR), p - values and adjusted p - values (p.adjust) were calculated by the Bejamini-Hochberg test and were considered significant when equal to or lower than 0.05. In addition, Log2-Fold Change (Log2FC) values were calculated. Those genes with a Log2FC greater than 2 and lower than -2 were considered up- and down-regulated, respectively. Genes in blood samples with a negative Log2FC were considered up-regulated in all cases.
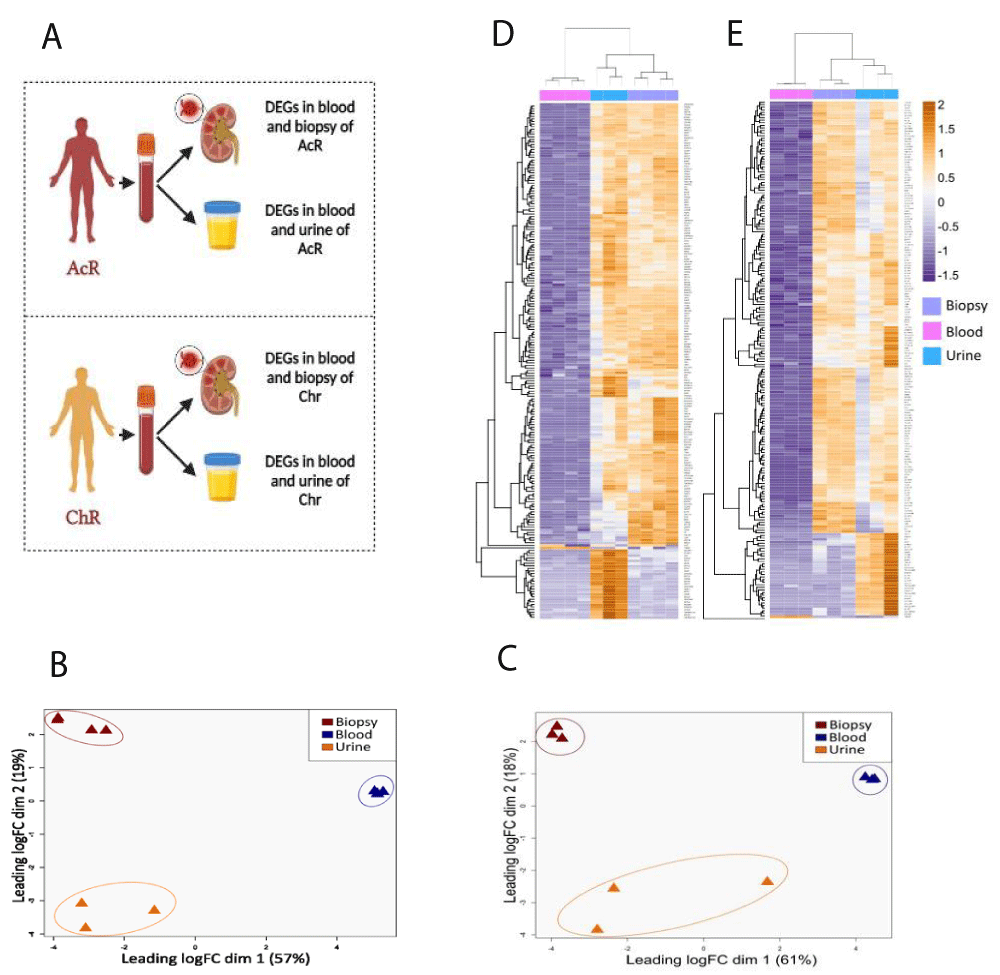
Figure 3: Global transcriptional differences between blood, renal biopsy, and urine samples from patients with acute and chronic renal allograft rejection. TMM-normalized RNA-Seq data from blood, biopsy, and urine samples were dimensionally reduced using multidimensional scaling (MDS) and unsupervised hierarchical clustering (HC) approaches. In both cases, Euclidean distance was used as the metric. A. Pairwise comparisons for the gene expression analysis. B-C. 2D-MDS plots showing the clustering of similar samples from patients with AcR (B) and ChR (C). The plot suggests a significant transcriptional signature between kidney tissue and urine sample D-E Hierarchically clustered heatmap of RNA-seq data from patients with AcR (D) and ChR (E). Columns, sample type; rows, genes. Fold-expression compared with blood: orange, increased; violet, decreased; white, no change. rejection.
Gene set enrichment analysis
Unsupervised Gene Set Enrichment Analysis (GSEA) was carried out with the ClusterProfiler (v3.16) package [23] in RStudio, using the gseGO function. All DEGs identified in pairwise comparisons (renal biopsy vs. blood, urine vs. blood, blood vs. renal biopsy, blood vs. urine) for patients with AcR and ChR were analyzed. The ontology selected was Biological Process (BP) with a cut-off p - value of 0.05 and using the Benjamini Hochberg adjustment method.
Identification of the most significant immune DEGs
From all DEGs found in pairwise comparisons in blood, urine, and renal biopsy samples, we selected up-regulated genes in urine and renal biopsy samples, and down-regulated genes in urine and renal biopsy samples (i.e., up-regulated in blood samples) for further exploration. Each set of up-regulated DEGs was analyzed using PANTHER17.0. From this analysis, the immune system process category (GO:0002376) was selected. Then, genes annotated to this functional category were identified and referred to as immune DEGs for subsequent analyses.
Cell enrichment analysis
Transcripts per million (TPM) in blood, renal biopsy, and urine samples from patients with AcR and ChR were calculated using the DGEobj.utils tool in EdgeR and the convertCounts function. TPM values were used as input for cell enrichment analysis using the xCell in RStudio [24]. The analysis yielded the fractions of different immune and stromal cell subtypes in each biological sample.
Renal histopathological findings in patients with acute and chronic renal allograft rejection
Renal biopsies from patients with AcR showed significant lymphocytic infiltration of the tubular epithelium, characteristic of severe tubulitis (Banff lesion score of t3) compatible with acute T-cell mediated rejection. Also, deposits of complement fragment C4d, indicative of complement activation, were found in some peritubular capillaries. On the other hand, in patients with ChR, a marked leukocyte margination was observed within the peritubular capillaries, a typical finding of tubular capillaritis probably resulting from chronic antibody-mediated rejection (Figure 1).
Transcriptome profile exploration by multidimensional scaling and hierarchical clustering analyses
RNA-seq data from peripheral blood, urine, and renal biopsy samples obtained from kidney transplant patients with AcR and ChR were explored independently by MDS and HC approaches to identify transcriptional differences among the three biological matrixes. Euclidean distance was used to determine the two-dimensional clustering of transcriptome profiles. Three clusters were observed according to the sample type in both groups of patients (Figure 3). In patients with AcR, dimensions explained 76% of the variance between the transcriptome profiles (dim.1 = 57%, dim.2 = 19%) (Figure 3B). Similarly, in patients with ChrR, dimensions explained 79% of the variance (dim.1 = 61%, dim.2 = 18%) (Figure 3C). Strikingly, for patients with AcR and ChR, the Euclidean distance between the renal biopsy and urine samples was smaller (dim.2) than the distance between these two specimens and the peripheral blood sample (dim.1), suggesting a transcriptional similarity between renal tissue and urine samples. HC analysis also showed the clustering of transcriptome profiles according to the sample type in both groups of patients (Figures 3D and 3E).
Differential gene expression analysis
The Robinson & Smyth exact test, run in EdgeR, helped identify the number of DEGs. To assume gene regulation, the following values were considered: FDR threshold, ≤ 0.05; Log2FC ≥ 2, for up-regulated genes; and Log2FC ≤ 2, for down-regulated genes. Differential gene expression analysis in the different biological matrixes was done independently for patients with AcR and ChR. Down-regulated genes (relative to renal biopsy and urine), were assumed to be up-regulated in peripheral blood for subsequent analyses.
Compared to blood samples, the number of up-regulated DEGs in renal biopsy and urine specimens were 4703 and 5038 respectively in patients with AcR (Figures 4A and 4B, and Supplementary Table 1) and 4671 and 3991 in the ChR group (Figure 4C and 4D and Supplementary Table 1). On the other hand, the number of genes up-regulated in blood samples compared to renal biopsy and urine specimens were respectively 1950 and 1147 in the AcR group (Figures 4A and 4B, and Supplementary Table 1) and 1966 and 755 in the ChR group (Figure 4C and 4D and Supplementary Table 1). These findings suggested a greater up-regulation of genes in the allografted tissue than in the peripheral blood of renal transplant patients, which was mirrored in urine samples.
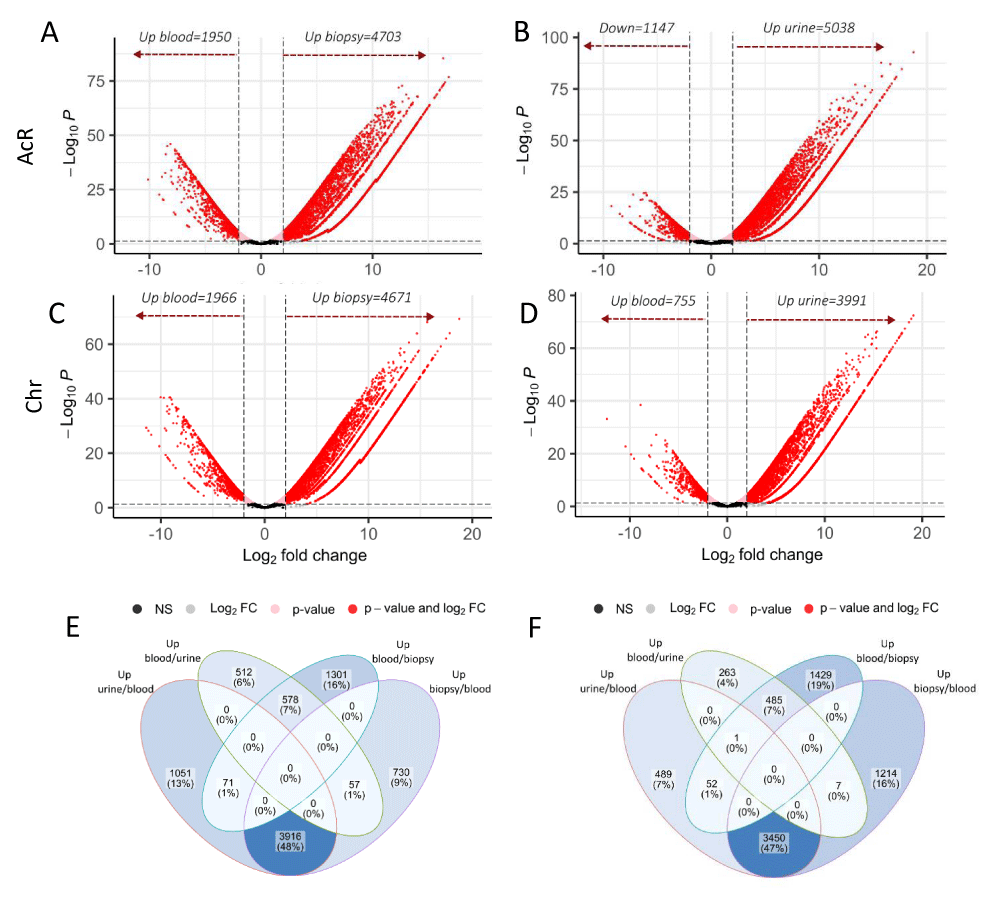
Figure 4: Global analyses of differential gene expression in blood, renal biopsy, and urine samples from patients with acute or chronic renal allograft rejection. The Robinson and Smyth exact test was used to determine the number of differentially expressed genes (DEGs) in the three biological matrixes in patients with acute (AcR) and chronic (ChR) allograft rejection. A-D. Volcano plots showing DEGs in renal biopsy vs. blood and blood vs. renal biopsy (A, C) and urine vs. blood and blood vs. urine (B, D) from patients with AcR (A, B) and ChR (C, D). Expression levels are shown as a function of log2FC (X-axis), considering a minimum value of 2. The minimum value for log10p.adjust (Y-axis) was 0.05. Genes with negative log2FC values in peripheral blood were considered as up-regulated compared to renal biopsy and urine samples in both patient groups. E-F. Veen diagrams showing regulated genes exclusively found in one sample type or shared by samples in patients with AcR (E) and ChR (F).
Next, we carried out a global exploration to identify the number of DEGs exclusively up-regulated (relative to blood) in urine or renal biopsy and those shared by both samples in patients with AcR and ChR. In the AcR group, 1051 (~13%) and 730 (~9%) up-regulated DEGs were found exclusively in urine and renal biopsy samples, respectively. Notably, urine and renal biopsy shared 3916 (~48%) up-regulated DEGs. On the other hand, only 578 (~7%) up-regulated DEGs were found in blood (relative to urine and renal biopsy) (Figure 4E and Supplementary Table 1). Similarly, in the ChR group, 489 (~7%) and 1214 (~16%) up-regulated DEGs were found exclusively in urine and renal biopsy samples respectively. Notably, urine and renal biopsy shared 3450 (~47%) up-regulated DEGs. On the contrary, only 485 (~7%) up-regulated DEGs were found in blood (relative to urine and renal biopsy) (Figure 4F and Supplementary Table 1).
Gene set enrichment analysis
The function of up-regulated DEGs in blood, urine, and renal biopsy specimens from patients with AcR and ChR, was investigated using unsupervised GSEA by gathering genes per each GO term (biological processes). In the AcR group, the GSEA showed that renal biopsy and urine samples (relative to blood) were enriched in BPs related to kidney development and morphogenesis (Figures 5A and 5B, left panels). In contrast, up-regulated DEGs in blood (relative to renal biopsy samples) were enriched in BPs, such as MyD88-dependent toll-like receptor signaling pathway, response to protozoan, defense response to protozoan, antigen processing and presentation of exogenous peptide, interleukin-12 production, regulation of interleukin-12 production, and regulation of CD4-positive alpha-beta T cell activation (Figure 5A, right panel). In addition, up-regulated DEGs in the blood (relative to urine samples) were enriched in BPs related to monocyte extravasation, regulation of the B-cell receptor signaling pathway, and the MyD88-dependent toll-like receptor signaling pathway (Figure 5B, right panel). The results of the GO term enrichment analysis were similar in patients with ChR. Specifically, renal biopsy and urine samples (relative to blood) were enriched in BPs related to kidney development (Figures 5C and 5D, left panels). Up-regulated DEGs in the blood (relative to renal biopsy samples) were enriched in BPs, such as B-cell receptor signaling pathway, activation of alpha-beta T-cells involved in the immune response, CD4-positive alpha-beta T-cell differentiation, MyD88-dependent toll-like receptor signaling pathway, B-cell proliferation, leukocyte homeostasis, and B cell activation involved in the immune response (Figure 5C, right panel). In addition, up-regulated DEGs in blood (relative to urine samples) were enriched in BPs, such as rRNA modification, somatic diversification of T-cell receptor genes, somatic recombination of T-cell receptor gene segments, T-cell receptor V(D)J recombination, regulation of B-cell receptor signaling pathway, regulation of natural killer cell-mediated cytotoxicity, and regulation of natural killer cell-mediated immunity (Figure 5D, right panel).
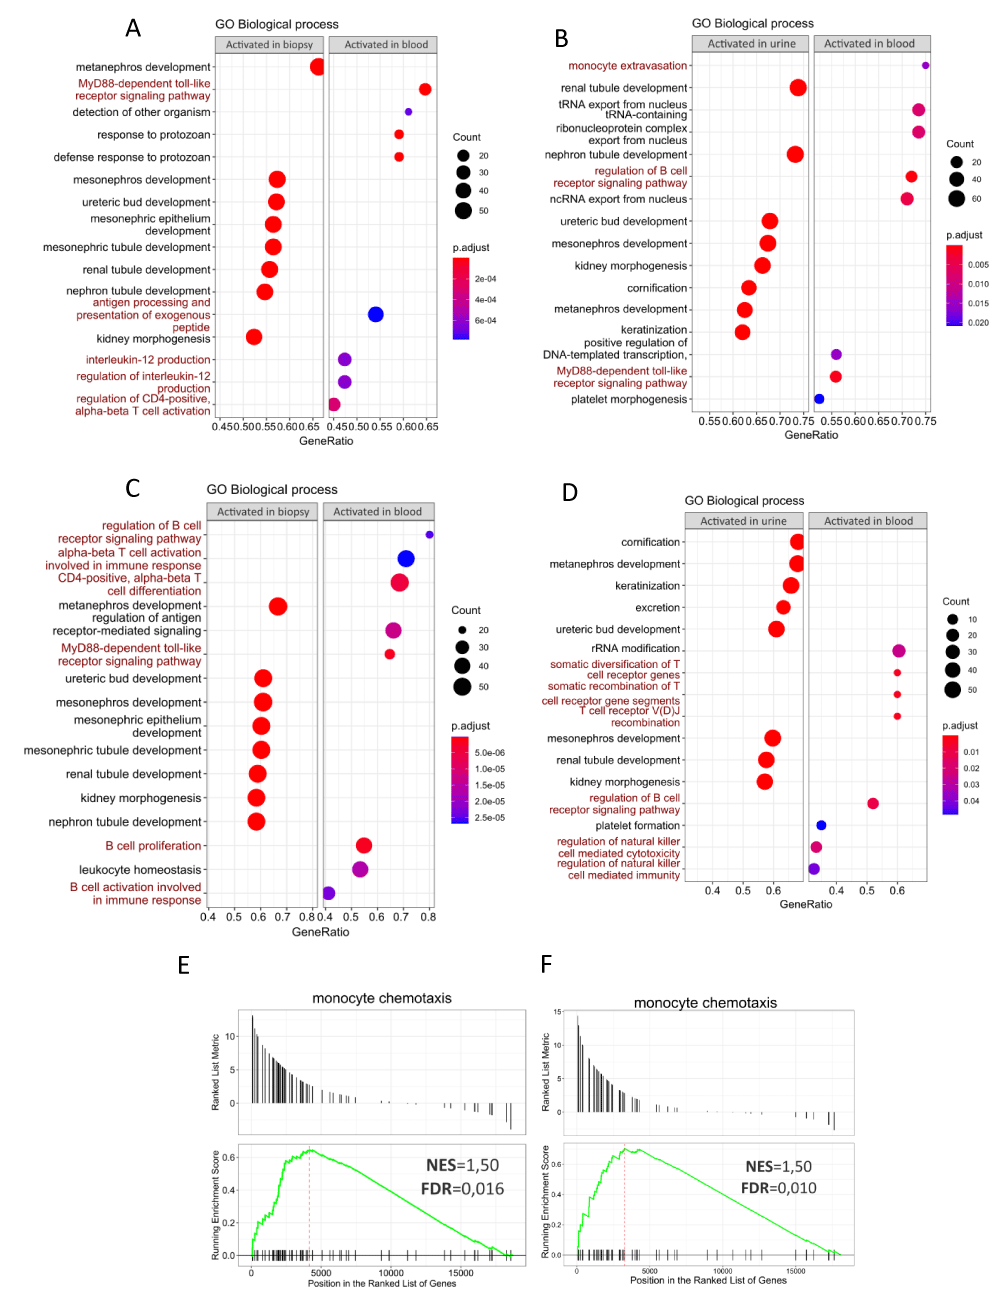
Figure 5: Gene Set Enrichment Analysis of differentially expressed genes in blood, renal biopsy, and urine samples from patients with acute and chronic renal allograft rejection. A-D. Dot plots showing GO biological processes (BPs) associated with up-regulated DEGs in renal biopsy and urine samples (relative to blood) in patients with AcR (A-B, left panels) and ChR (C-D, left panels). Also shown are BPs associated with up-regulated DEGs in blood relative to renal biopsy and urine in patients with AcR (A-B, right panels) and ChR (C-D, right panels). Count refers to the number of up-regulated DEGs associated with each BP. Statistical significance was set for adjusted p - values (p.adjust) lower than 0.05. In both groups of patients, up-regulated DEGs in peripheral blood were primarily enriched in immunological processes, whereas those in renal biopsy and urine samples, were particularly enriched in BPs associated with renal development, morphogenesis, and function. E, F. GSEA plots showing enrichment of the monocyte chemotaxis category in urine samples from patients with AcR (E) and ChR (F).
In summary, in patients with AcR and ChR, peripheral blood samples (compared with renal biopsy and urine samples) were enriched in BPs associated with the immune response, but renal biopsy and urine samples (compared with blood samples) were enriched in BPs associated with renal development and morphogenesis, even though the immune response is well-known to impact on renal allograft directly. To address this discrepancy, we hypothesized that genes associated with immune response activation were also overexpressed in renal tissue but overlapped with those associated with renal development because similar inflammatory mechanisms mediate both the immune response and the tissue remodeling process. This hypothesis could explain the enrichment of BPs such as cornification and keratinization in renal biopsy specimens.
Identification and functional analysis of immune DEGs
To gain insight into DEGs and immune mechanisms in the renal allograft and to evaluate their presence in the urine, we focused on identifying immune response-related genes (hereafter immune DEGs) and enriched GO term (biological processes) in renal biopsy and urine samples. Although the unsupervised GSEA determined a significant enrichment of effector immunological mechanism in the peripheral blood samples from patients with AcR and ChR, it is essential to note that their urine samples were also enriched in the monocyte chemotaxis category (Figures 4E and 4F and Supplementary Table 1). This finding evidenced that, although enrichment of immune-related processes was preponderant in the peripheral blood samples, some biological processes in the renal allograft were reflected in up-regulated genes in the urine samples.
Therefore, to address this analysis, we specifically identified genes annotated by the GO term Immune System Process (GO:0002376) among the up-regulated DEGs shared by urine and renal biopsy samples and those up-regulated in blood samples from patients with AcR and ChR (Figures 4E, 4F). Analyses showed that 67/3916 (AcR) and 64/3450 (ChR) up-regulated DEGs shared by renal biopsy and urine samples were immune genes. In addition, 51/578 (AcR) and 62/485 (ChR) up-regulated DEGs in peripheral blood samples were also associated with the immune system process (Figure 6A). Overall, the fraction of up-regulated immune DEGs was higher in peripheral blood than in renal biopsy and urine samples in both patient groups, consistent with previous findings of a higher enrichment of immune response-associated functional categories in peripheral blood samples.
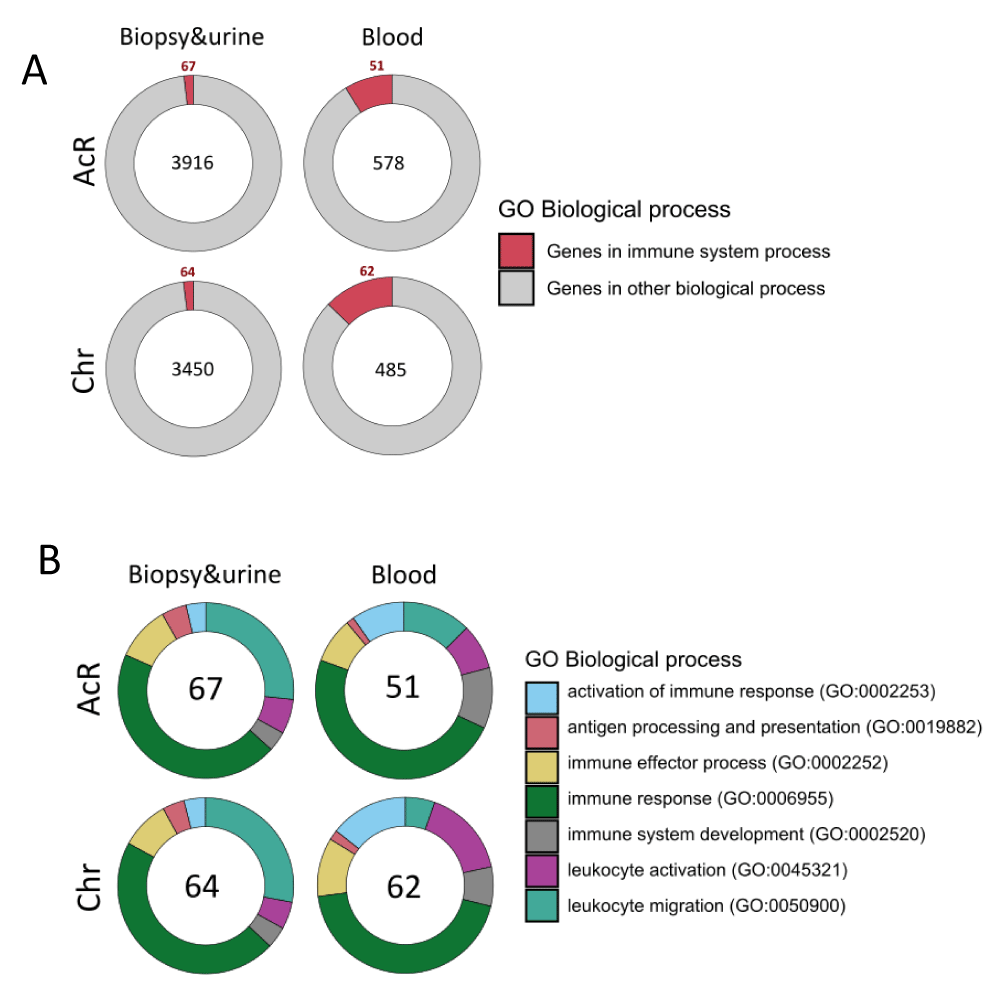
Figure 6: GO term enrichment analysis of up-regulated immune DEGs in renal biopsy, urine, and peripheral blood samples from patients with acute and chronic allograft rejection. A. Pie chart showing the fraction of up-regulated immune DEGs shared by renal biopsy and urine specimens (relative to blood) and in peripheral blood samples (those overlapping upon comparison with renal biopsy and urine). B. Pie chart showing the enriched immune processes-related GO terms found in up-regulated immune DEGs shared by renal biopsy and urine specimens and in peripheral blood samples.
These up-regulated immune DEGs were then analyzed to identify the most enriched immunological processes. Up-regulated immune DEGs shared by renal biopsy and urine samples were enriched in the GO terms immune response (GO:0006955): 49 and 46 genes in patients with AcR and ChR, respectively, and leukocyte migration process (GO:0050900): 29 and 28 genes in patients with AcR and ChR, respectively (Figure 6B and Supplementary Table 1). These findings showed that, together with the enrichment of tissue remodeling processes (renal development and morphogenesis), immune activation can be observed from the transcriptional perspective, specifically associated with chemotaxis. On the other hand, up-regulated immune DEGs in blood samples were mainly enriched in the GO terms immune response (GO:0006955): 35 and 48 genes in patients with AcR and ChR, respectively, followed by leukocyte migration (GO:0050900) and immune system development (GO:0002520) in patients with AcR; and leukocyte activation (GO:0045321) and immune effector process (GO:0002252) in patients with ChR (Figure 6B and Supplementary Table 1). Interestingly, a higher enrichment of genes associated with antigen processing and presentation was observed in biopsy and urine than in peripheral blood samples (Figure 6B).
The next step of the analysis consisted of identifying the genes associated with those BPs mainly enriched in renal biopsy and urine, and in blood samples from patients with renal allograft rejection. Within the leukocyte migration process, genes encoding chemokines such as CCL13, CCL14, CCL15, CCL17, CCL19, CCL2, CCL20, CCL22, CCL24, CCL8, CX3CL1, CXCL10, CXCL11, CXCL13, CXCL2, CXCL6 and CXCL9 were found in renal biopsy and urine samples from patients with AcR and ChR; CCL11 and CCL16 exclusively in patients with AcR; and CCL21 exclusively in patients with ChR. Interestingly, genes encoding chemokine receptors were identified in peripheral blood samples from patients with allograft rejection; specifically, CCR2, CCR3, CX3CR1, CXCR1, and CXCR2 in patients with AcR, and CCR2, CCR4, CCR6, CCR7, and CXCR5 in patients with ChR (Supplementary Table 1).
Cell enrichment analysis
RNA-seq data were subjected to cell enrichment analysis using the Xcell package in R. In patients with AcR, peripheral blood samples were significantly enriched in B cells and class-switched memory B cells (Figures 7A, 7D, and 7E), showed a non-significant trend toward enrichment in CD8+ T cells, and were subtly enriched in mast cells, and naïve B cells. In addition, renal biopsy and urine were enriched in fibroblasts; and blood and urine samples showed a trend toward enrichment in monocytes and neutrophils (Figure 7A). In patients with ChR, renal biopsy and peripheral blood samples showed a trend toward enrichment in CD8+ T cells, class-switched memory B cells, and more subtly in neutrophils and B cells. In addition, urine samples were enriched in fibroblasts and showed a trend toward enrichment in macrophages and monocytes (Figure 7A). Immune cell scores were higher than stromal cell ones in peripheral blood samples but similar in renal biopsy and urine samples from patients with AcR and ChR. These findings reinforce the hypothesis above regarding renal biopsy enrichment in biological processes related to kidney development and morphogenesis, given that tissue remodeling is associated with inflammation during allograft rejection.
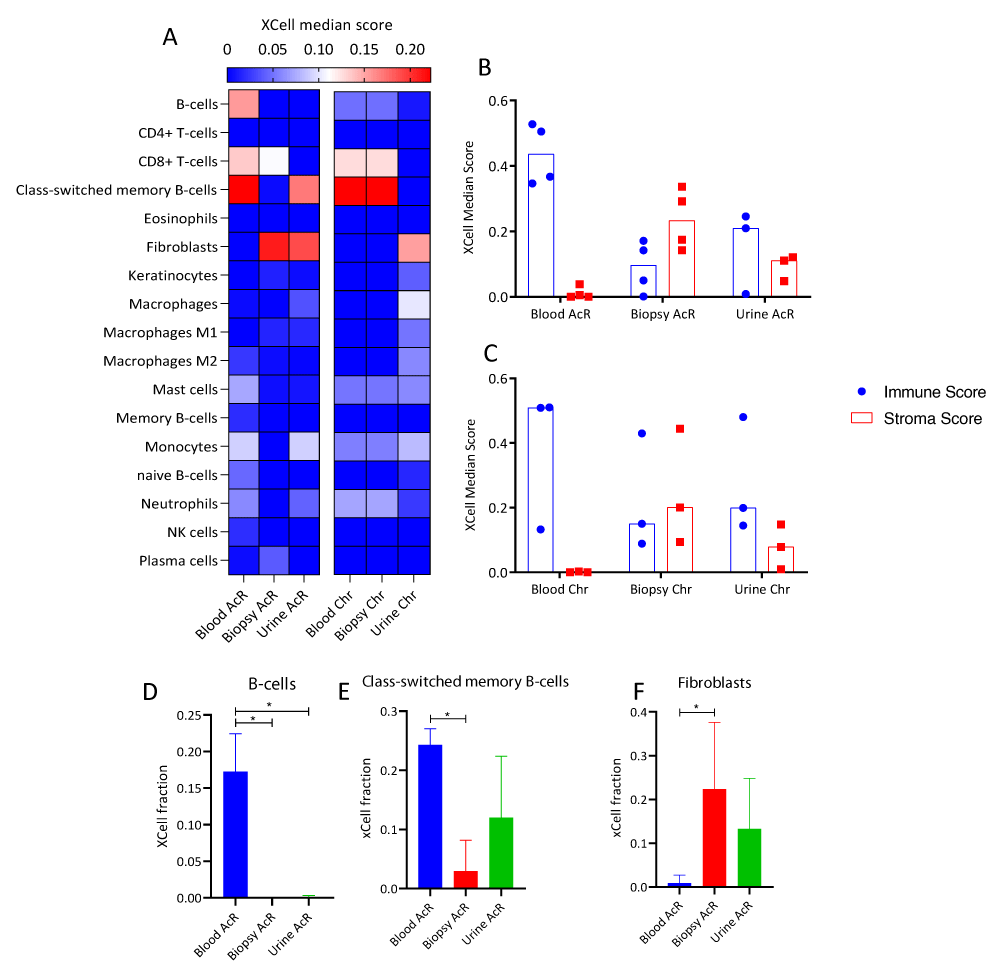
Figure 7: Cell-type enrichment analysis of transcriptome profiles of peripheral blood, renal biopsy, and urine samples from patients with acute and chronic allograft rejection. A. Heatmap of immune and stromal cell enrichment showing xCell median score. Rows: cell types, columns: biological matrixes of patients with acute (AcR) and chronic (ChR) renal allograft rejection. B-C. Column plots showing xCell scores for immune and stromal cells in biological matrixes from patients with AcR (B) and ChR (C). The immune and stromal xCell scores result from summing the scores of cell subsets associated with the immune response or the stroma, respectively. D-F Column charts of the xCell scores of B-cells (D), class-switched memory B-cells (E), and fibroblasts (F) in biological matrixes from patients with AcR and ChR. The microenvironment score resulted from summing the immune and stromal cell scores.
Although kidney transplantation represents an optimal therapeutic approach for patients with chronic kidney disease [25], different problems, including rejection, continue to affect long-term graft survival, even under maintenance therapy with immunomodulatory drugs. Many efforts have been made to overcome these limitations based on understanding the immunomolecular mechanisms involved in transplantation since specific immune effector mechanisms mediate graft acceptance or rejection after allorecognition.
Knowledge of the transcriptomic profiles triggered in renal transplant patients has been an important research focus, as it would help identify intra- and interindividual differences responsible for graft acceptance or rejection. This knowledge could also be helpful in clinical practice. Indeed, their implementation in biological matrixes, such as blood, renal tissue, or urine, would make it possible to predict risk before allografting, facilitate the follow-up of transplanted patients, and become a rapid and sensitive diagnostic tool of rejection. Although some up-regulated genes have been proposed as potential biomarkers in renal transplant patients, no molecular profile exists in the clinical practice to determine graft acceptance or differentiate acute from chronic rejection.
To better understand the immunological effector mechanisms involved in renal allograft rejection, in this work, we set out to analyze differential gene expression and associated functions in peripheral blood, renal biopsy, and urine samples from kidney transplant patients with AcR and ChR. The research hypothesis stated that the immunological processes mediating the response against the renal allograft differ in peripheral blood and renal biopsy, as circulating effector cells are required to migrate to the renal allograft, where cellular and humoral immune effector mechanisms take place; consequently, renal biopsy DEGs could be reflected in urine samples.
According to the analyses of the transcriptome profiles, four relevant aspects were identified: i) the transcriptional similarity between renal biopsy and urine specimens, ii) the enrichment of renal development and morphogenesis process over immune system processes in the renal allograft, iii) the up-regulation of genes associated with chemotaxis in the three biological matrixes, and, iv) the similarity of findings in patients with AcR and ChR.
Several authors have proposed urine sampling as a non-invasive alternative to identify biomarkers associated with renal allograft status. Direct contact between urine and renal allograft increases the probability of detecting renal DNA, RNA, proteins, or cells in urine samples [26]. However, concordance between renal biopsy and urine molecular profiles has yet to be established. In 2020, Verma, et al. used RNA-seq to assess differential gene expression in renal biopsy and urine samples from renal transplant patients with stable allograft function, TCMR, and AMR. In patients with TCMR, 356 and 102 up-regulated DEGs were identified in renal biopsy and urine samples, respectively; 75 of these genes were shared by both samples. In patients with AMR, 536 and 347 up-regulated DEGs were found in renal biopsy and urine samples, respectively; 187 of these genes were shared by both samples [27]. In another study by Jung-Woo Seo, et al. mRNA transcripts of 14 genes, including CXCL9, CIQB, LCK, and FOXP3, were up-regulated in renal biopsy and urine samples from kidney transplant patients with AcR compared to patients with stable renal allograft. In addition, increased CXCL9 expression was observed by in situ hybridization [28]. Increased chemokine expression was also observed in the present work. Furthermore, in agreement with previous studies, we found that renal biopsy and urine samples from patients with renal allograft rejection shared about 48% of up-regulated DEGs. Therefore, as proposed by Verma, et al. it is possible to consider the renal allograft as a molecular sorter whose products can be subsequently detected in urine.
To address the level of transcriptional similarity between renal biopsy and urine samples, functional analyses were performed to identify BPs shared by the two biological matrixes. GSEA showed that renal and urine biopsy samples from AcR and ChR patients were enriched in BPs such as renal development, renal morphogenesis, keratinization, and cornification. Furthermore, compared with renal biopsy and urine samples, peripheral blood samples from AcR patients were enriched in T-cell activation processes and those from ChR patients in B-cell activation processes. Although these findings seem contradictory, considering that allograft rejection is an immune-mediated process, we hypothesized that inflammatory mechanisms triggered by the innate and adaptive response within the renal allograft progressively induce tissue remodeling. In the first place, the renal allograft contains very diverse cells and molecules [29], and the number of cells that make up the kidney exceeds the number of immune cells; in the second place, tissue remodeling processes stimulated by inflammation are associated with rejection and induce proliferation of cells such as fibroblasts and biological processes such as angiogenesis [30-32]. Likewise, it is known that fibrosis can result from inflammatory processes that arise during allograft rejection mediated by the humoral response [33]. These tissue remodeling processes could then be superimposed on those of the immune, thus explaining the enrichment of renal development and morphogenesis process mentioned above. Indeed, this hypothesis is consistent with the elevated fibroblast score and up-regulated VEGF observed in urine and renal biopsy samples. VEGF is an angiogenic factor that promotes endothelial proliferation, differentiation, and survival and is involved in vasodilation, a biological process required for endothelial activation leading to leukocyte migration [34].
We also evaluated the enrichment of up-regulated immune DEGs and immune system-related BPs in renal biopsy and urine compared to peripheral blood samples from patients with AcR and ChR. Functional analyses showed that up-regulated DEGs in those samples were enriched in the GO term immune system processes (GO:0002376). Notably, up-regulated immune DEGs in renal biopsy and urine samples were enriched in genes coding for chemokines and those in peripheral blood samples for chemokine receptors. This finding is striking, given the role of chemokines in the anti-allograft response. Indeed, different authors have focused on evaluating the expression levels of chemokines and chemokine receptors to assess their potential value as biomarkers of renal allograft rejection [35,36]. Some studies have reported up-regulation of CXCL9, CXCL10, and CXCL11 in renal biopsy and urine samples. These molecules play an essential role in the migration of CD4+ and CD8+ T cells and NK cells into the allograft upon interacting with the common surface receptor CXCR3 [36]. Elevated urinary CXCL10 mRNA levels have also been reported in kidney transplant patients as a diagnostic marker of rejection [37], and elevated urinary CXCL9, CXCL10, and CXCL11 levels are observed in patients with humoral and cell-mediated rejection [36].
On the other hand, up-regulated DEGs in peripheral blood samples were enriched in CCR3 in patients with AcR and CCR4, CCR6, CCR7, and CXCR5 in patients with ChR. Interestingly, in both patient groups, up-regulated DEGs encoding CCL3 (CCR3 ligand), CCL17 (CCR4 ligand), CXCL13 (CXCR5 ligand), CCL19 (CCR7 ligand), and CCL21 (CCR7 ligand; only in patients with ChR) were found in renal biopsy and urine samples [38].
The transcriptomic profiles of peripheral blood, renal biopsy, and urine samples from patients with AcR and ChR were similar, suggesting activation of common immune mechanisms in both types of allograft rejection. Indeed, Figure 2 shows deposits of the complement fragment C4d —compatible with the formation of immune complexes in the graft— in biopsies from patients with AcR. This finding evidenced that, despite the predominance of a cellular immune response in AcR, a humoral response, more typical of ChR, can also occur.
We conclude in the first place that transcriptomic profiles of renal biopsy and urine samples from kidney transplant patients with acute and chronic allograft rejection were similar, as demonstrated by MDS analysis and the number of up-regulated DEGs found in both samples. Despite similar reports in the literature [39], this finding was the most relevant result of the present study because we found that about 48% of renal allograft DEGs could be subsequently detected in urine. Thus, urine samples might be appropriate to detect molecules associated with acute or chronic renal allograft rejection. In the second place, aside from the similar number of DEGs in renal biopsy and urine samples, we found they were enriched in similar BPs relevant to delving into the immune mechanisms triggered in the renal allograft. In particular, a set of up-regulated DEGs in renal graft biopsies and urine samples encoded chemokines, whereas peripheral blood samples were enriched in up-regulated DEGs encoding chemokine receptors. These findings could be related to the migration of immune cells from the blood circulation to the allograft through activated endothelia. The pro-inflammatory environment generated in the renal allograft favors AcR or ChR. Over time, rejection promotes tissue regeneration and remodeling through fibrosis and keratinization. However, immune responses against the renal allograft remain active, with a predominance of a cellular response in acute rejection and a humoral response in chronic rejection, as shown in Figure 2. According to the present results, urine could be proposed as an appropriate biological matrix to identify molecules and biological processes associated with renal allograft rejection. However, validating the molecules and processes identified here requires further investigation involving a larger patient population.
The authors would like to acknowledge COLCIENCIAS for the funding and the Renal Facility of the Hospital Pablo Tobón Uribe for patient recruitment.
Supportive foundations: This work was supported by the Departamento Administrativo de Ciencia Tecnología e Innovación (COLCIENCIAS), Convocatoria 712-2015 para proyectos de investigación en Ciencias Básicas, Colombia.
Ethical Approval Statement: All patients signed an informed consent approved by the Ethics Committee from the Sede de Investigación Universitaria (SIU), Universidad de Antioquia, Medellín, Colombia.
Conflict of interest Statement: Carlos Carmona, Marlon Castrillón, John Fredy Nieto, Gustavo Zuluaga, Luis Fernando Arias, and Cristian Álvarez have nothing to disclose.
Data availability: The data that support the findings of this study are openly available in Gene Expression Omnibus (GEO) repository with the reference number GSE242302.
Supplementary information: Supplementary Table 1, provides information about differentially expressed genes.
ARRIVE guidelines statement: The authors have read the ARRIVE guidelines, and the manuscript was prepared and revised according to the ARRIVE guidelines.
- Lentine KL, Smith JM, Hart A, Miller J, Skeans MA, Larkin L, Robinson A, Gauntt K, Israni AK, Hirose R, Snyder JJ. OPTN/SRTR 2020 Annual Data Report: Kidney. Am J Transplant. 2022 Mar;22 Suppl 2:21-136. doi: 10.1111/ajt.16982. PMID: 35266618.
- Joosten SA, Sijpkens YW, van Kooten C, Paul LC. Chronic renal allograft rejection: pathophysiologic considerations. Kidney Int. 2005 Jul;68(1):1-13. doi: 10.1111/j.1523-1755.2005.00376.x. PMID: 15954891.
- Iwahara N, Hotta K, Iwami D, Tanabe T, Tanaka Y, Ito YM, Otsuka T, Murai S, Takada Y, Higuchi H, Sasaki H, Hirose T, Harada H, Shinohara N. Analysis of T-cell alloantigen response via a direct pathway in kidney transplant recipients with donor-specific antibodies. Front Immunol. 2023 May 3;14:1164794. doi: 10.3389/fimmu.2023.1164794. PMID: 37207202; PMCID: PMC10189043.
- Etxebarria A, Díez-Martín E, Astigarraga E, Barreda-Gómez G. Role of the Immune System in Renal Transplantation, Types of Response, Technical Approaches and Current Challenges. Immuno. 2022; 2(4): 548–570. https://doi.org/10.3390/immuno2040035
- Farrar CA, Kupiec-Weglinski JW, Sacks SH. The innate immune system and transplantation. Cold Spring Harb Perspect Med. 2013 Oct 1;3(10):a015479. doi: 10.1101/cshperspect.a015479. PMID: 24086066; PMCID: PMC3784815.
- Callemeyn J, Lamarthée B, Koenig A, Koshy P, Thaunat O, Naesens M. Allorecognition and the spectrum of kidney transplant rejection. Kidney Int. 2022 Apr;101(4):692-710. doi: 10.1016/j.kint.2021.11.029. Epub 2021 Dec 13. PMID: 34915041.
- Siu JHY, Surendrakumar V, Richards JA, Pettigrew GJ. T cell Allorecognition Pathways in Solid Organ Transplantation. Front Immunol. 2018 Nov 5;9:2548. doi: 10.3389/fimmu.2018.02548. PMID: 30455697; PMCID: PMC6230624.
- Grafals M, Thurman JM. The Role of Complement in Organ Transplantation. Front Immunol. 2019 Oct 4;10:2380. doi: 10.3389/fimmu.2019.02380. PMID: 31636644; PMCID: PMC6788431.
- Krupickova L, Fialova M, Novotny M, Svachova V, Mezerova K, Cecrdlova E, Viklicky O, Striz I. Chemokine Profiles Are Affected in Serum of Patients with Acute Rejection of Kidney Allograft. Mediators Inflamm. 2021 Mar 11;2021:5513690. doi: 10.1155/2021/5513690. PMID: 33776571; PMCID: PMC7979290.
- Wang S, Zhang C, Wang J, Yang C, Xu M, Rong R, Zhu T, Zhu D. Endothelial Cells in Antibody-Mediated Rejection of Kidney Transplantation: Pathogenesis Mechanisms and Therapeutic Implications. J Immunol Res. 2017;2017:8746303. doi: 10.1155/2017/8746303. Epub 2017 Feb 1. Erratum in: J Immunol Res. 2019 Mar 10;2019:9691679. PMID: 28255564; PMCID: PMC5309424.
- Chia PY, Teo A, Yeo TW. Overview of the Assessment of Endothelial Function in Humans. Front Med (Lausanne). 2020 Oct 7;7:542567. doi: 10.3389/fmed.2020.542567. PMID: 33117828; PMCID: PMC7575777.
- Kummer L, Zaradzki M, Vijayan V, Arif R, Weigand MA, Immenschuh S, Wagner AH, Larmann J. Vascular Signaling in Allogenic Solid Organ Transplantation - The Role of Endothelial Cells. Front Physiol. 2020 May 8;11:443. doi: 10.3389/fphys.2020.00443. PMID: 32457653; PMCID: PMC7227440.
- Venner JM, Famulski KS, Badr D, Hidalgo LG, Chang J, Halloran PF. Molecular landscape of T cell-mediated rejection in human kidney transplants: prominence of CTLA4 and PD ligands. Am J Transplant. 2014 Nov;14(11):2565-76. doi: 10.1111/ajt.12946. Epub 2014 Sep 12. PMID: 25219326.
- Wang Y, Zhang D, Hu X. A Three-Gene Peripheral Blood Potential Diagnosis Signature for Acute Rejection in Renal Transplantation. Front Mol Biosci. 2021 May 4;8:661661. doi: 10.3389/fmolb.2021.661661. PMID: 34017855; PMCID: PMC8129004.
- Jeong HJ. Diagnosis of renal transplant rejection: Banff classification and beyond. Kidney Res Clin Pract. 2020 Mar 31;39(1):17-31. doi: 10.23876/j.krcp.20.003. PMID: 32164120; PMCID: PMC7105630.
- Trajceska L, Severova-Andreevska G, Dzekova-Vidimliski P, Nikolov I, Selim G, Spasovski G, Rambabova-Busletik I, Ristovska V, Grcevska L, Sikole A. Complications and Risks of Percutaneous Renal Biopsy. Open Access Maced J Med Sci. 2019 Mar 29;7(6):992-995. doi: 10.3889/oamjms.2019.226. PMID: 30976347; PMCID: PMC6454172.
- Brachemi S, Bollée G. Renal biopsy practice: What is the gold standard? World J Nephrol. 2014 Nov 6;3(4):287-94. doi: 10.5527/wjn.v3.i4.287. PMID: 25374824; PMCID: PMC4220363.
- Sakai K, Oguchi H, Muramatsu M, Shishido S. Protocol graft biopsy in kidney transplantation. Nephrology (Carlton). 2018 Jul;23 Suppl 2:38-44. doi: 10.1111/nep.13282. PMID: 29968403.
- Martínez-Fernández M, Paramio JM, Dueñas M. RNA Detection in Urine: From RNA Extraction to Good Normalizer Molecules. J Mol Diagn. 2016 Jan;18(1):15-22. doi: 10.1016/j.jmoldx.2015.07.008. Epub 2015 Nov 14. PMID: 26586227.
- Dobin A, Davis CA, Schlesinger F, Drenkow J, Zaleski C, Jha S, Batut P, Chaisson M, Gingeras TR. STAR: ultrafast universal RNA-seq aligner. Bioinformatics. 2013 Jan 1;29(1):15-21. doi: 10.1093/bioinformatics/bts635. Epub 2012 Oct 25. PMID: 23104886; PMCID: PMC3530905.
- Robinson MD, McCarthy DJ, Smyth GK. edgeR: a Bioconductor package for differential expression analysis of digital gene expression data. Bioinformatics. 2010 Jan 1;26(1):139-40. doi: 10.1093/bioinformatics/btp616. Epub 2009 Nov 11. PMID: 19910308; PMCID: PMC2796818.
- Smedley D, Haider S, Ballester B, Holland R, London D, Thorisson G, Kasprzyk A. BioMart--biological queries made easy. BMC Genomics. 2009 Jan 14;10:22. doi: 10.1186/1471-2164-10-22. PMID: 19144180; PMCID: PMC2649164.
- Yu G, Wang LG, Han Y, He QY. clusterProfiler: an R package for comparing biological themes among gene clusters. OMICS. 2012 May;16(5):284-7. doi: 10.1089/omi.2011.0118. Epub 2012 Mar 28. PMID: 22455463; PMCID: PMC3339379.
- Aran D, Hu Z, Butte AJ. xCell: digitally portraying the tissue cellular heterogeneity landscape. Genome Biol. 2017 Nov 15;18(1):220. doi: 10.1186/s13059-017-1349-1. PMID: 29141660; PMCID: PMC5688663.
- Sawinski D, Poggio ED. Introduction to Kidney Transplantation: Long-Term Management Challenges. Clin J Am Soc Nephrol. 2021 Aug;16(8):1262-1263. doi: 10.2215/CJN.13440820. Epub 2021 Mar 10. PMID: 33692119; PMCID: PMC8455035.
- Guzzi F, Cirillo L, Buti E, Becherucci F, Errichiello C, Roperto RM, Hunter JP, Romagnani P. Urinary Biomarkers for Diagnosis and Prediction of Acute Kidney Allograft Rejection: A Systematic Review. Int J Mol Sci. 2020 Sep 19;21(18):6889. doi: 10.3390/ijms21186889. PMID: 32961825; PMCID: PMC7555436.
- Snopkowski C, Salinas T, Li C, Stryjniak G, Ding R, Sharma V, Suthanthiran M. Urinary cell mRNA profiling of kidney allograft recipients: A systematic investigation of a filtration based protocol for the simplification of urine processing. J Immunol Methods. 2021 Nov;498:113132. doi: 10.1016/j.jim.2021.113132. Epub 2021 Aug 28. PMID: 34464607; PMCID: PMC8487946.
- Seo JW, Lee YH, Tae DH, Park SH, Moon JY, Jeong KH, Kim CD, Chung BH, Park JB, Kim YH, Seok J, Joo SH, Lee SH, Lee JS, Lee SH. Non-Invasive Diagnosis for Acute Rejection Using Urinary mRNA Signature Reflecting Allograft Status in Kidney Transplantation. Front Immunol. 2021 Jun 10;12:656632. doi: 10.3389/fimmu.2021.656632. Erratum in: Front Immunol. 2022 Jan 06;12:825243. PMID: 34177898; PMCID: PMC8222723.
- Rychkov D, Sur S, Sirota M, Sarwal MM. Molecular Diversity of Clinically Stable Human Kidney Allografts. JAMA Netw Open. 2021 Jan 4;4(1):e2035048. doi: 10.1001/jamanetworkopen.2020.35048. PMID: 33492376; PMCID: PMC7835722.
- Frangogiannis NG. The In fl ammatory Response in Tissue Repair 60 . 2 Initiation of the In fl ammatory Response Following Injury : The Alarmins. 2018; 1517–1537.
- Mata R, Yao Y, Cao W, Ding J, Zhou T, Zhai Z, Gao C. The Dynamic Inflammatory Tissue Microenvironment: Signality and Disease Therapy by Biomaterials. Research (Wash D C). 2021 Feb 3;2021:4189516. doi: 10.34133/2021/4189516. PMID: 33623917; PMCID: PMC7879376.
- Soliman AM, Barreda DR. Acute Inflammation in Tissue Healing. Int J Mol Sci. 2022 Dec 30;24(1):641. doi: 10.3390/ijms24010641. PMID: 36614083; PMCID: PMC9820461.
- Torres IB, Moreso F, Sarró E, Meseguer A, Serón D. The Interplay between inflammation and fibrosis in kidney transplantation. Biomed Res Int. 2014;2014:750602. doi: 10.1155/2014/750602. Epub 2014 Jun 4. PMID: 24991565; PMCID: PMC4065724.
- Schrijvers BF, Flyvbjerg A, De Vriese AS. The role of vascular endothelial growth factor (VEGF) in renal pathophysiology. Kidney Int. 2004 Jun;65(6):2003-17. doi: 10.1111/j.1523-1755.2004.00621.x. PMID: 15149314.
- Gielis EM, Anholts JDH, van Beelen E, Haasnoot GW, De Fijter HW, Bajema I, Heidt S, van de Vrie M, Hilbrands LB, Mallat MJK, Ledeganck KJ, Claas FHJ, Eikmans M. A Combined microRNA and Chemokine Profile in Urine to Identify Rejection After Kidney Transplantation. Transplant Direct. 2021 Jun 10;7(7):e711. doi: 10.1097/TXD.0000000000001169. PMID: 34131583; PMCID: PMC8196093.
- Mühlbacher J, Doberer K, Kozakowski N, Regele H, Camovic S, Haindl S, Bond G, Haslacher H, Eskandary F, Reeve J, Böhmig GA, Wahrmann M. Non-invasive Chemokine Detection: Improved Prediction of Antibody-Mediated Rejection in Donor-Specific Antibody-Positive Renal Allograft Recipients. Front Med (Lausanne). 2020 Apr 9;7:114. doi: 10.3389/fmed.2020.00114. PMID: 32328494; PMCID: PMC7160229.
- Handschin J, Wehmeier C, Amico P, Hopfer H, Dickenmann M, Schaub S, Hirt-Minkowski P. Urinary CXCL10 Measurement in Late Renal Allograft Biopsies Predicts Outcome Even in Histologically Quiescent Patients. Transplant Proc. 2021 Sep;53(7):2168-2179. doi: 10.1016/j.transproceed.2021.07.013. Epub 2021 Aug 19. PMID: 34419254.
- Hughes CE, Nibbs RJB. A guide to chemokines and their receptors. FEBS J. 2018 Aug;285(16):2944-2971. doi: 10.1111/febs.14466. Epub 2018 Apr 24. PMID: 29637711; PMCID: PMC6120486.
- Lim JH, Chung BH, Lee SH, Jung HY, Choi JY, Cho JH, Park SH, Kim YL, Kim CD. Omics-based biomarkers for diagnosis and prediction of kidney allograft rejection. Korean J Intern Med. 2022 May;37(3):520-533. doi: 10.3904/kjim.2021.518. Epub 2022 Apr 15. PMID: 35417937; PMCID: PMC9082440.
- Oweira H, Ramouz A, Ghamarnejad O, Khajeh E, Ali-Hasan-Al-Saegh S, Nikbakhsh R, Reißfelder C, Rahbari N, Mehrabi A, Sadeghi M. Risk Factors of Rejection in Renal Transplant Recipients: A Narrative Review. J Clin Med. 2022 Mar 3;11(5):1392. doi: 10.3390/jcm11051392. PMID: 35268482; PMCID: PMC8911293.