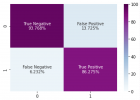
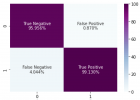
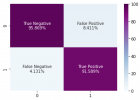
Figure 0
Applications of convolutional neural networks in chest X-ray analyses for the detection of COVID-19
Patrick Ting*, Anish Kasam and Kevin Lan
Published: 20 January, 2022 | Volume 6 - Issue 1 | Pages: 001-007

Figure 0:
The area under the normal distribution curve bounded by the blue line represents the p - value of the t - test conducted to evaluate the difference between proportions for the accuracy of VGG16 and MobileNetV2.
Read Full Article HTML DOI: 10.29328/journal.abse.1001015 Cite this Article Read Full Article PDF
More Images
Similar Articles
-
A review article on artificial intelligenceNagendraswamy C*,Amogh Salis. A review article on artificial intelligence. . 2021 doi: 10.29328/journal.abse.1001012; 5: 013-014
-
Applications of convolutional neural networks in chest X-ray analyses for the detection of COVID-19Patrick Ting*,Anish Kasam,Kevin Lan. Applications of convolutional neural networks in chest X-ray analyses for the detection of COVID-19. . 2022 doi: 10.29328/journal.abse.1001015; 6: 001-007
-
Feasibility study of magnetic sensing for detecting single-neuron action potentialsDenis Tonini,Kai Wu,Renata Saha,Jian-Ping Wang*. Feasibility study of magnetic sensing for detecting single-neuron action potentials. . 2022 doi: 10.29328/journal.abse.1001018; 6: 019-029
-
Artificial awareness, as an innovative learning method and its application in science and technologyAdamski Adam*,Adamska Julia. Artificial awareness, as an innovative learning method and its application in science and technology. . 2023 doi: 10.29328/journal.abse.1001020; 7: 012-019
Recently Viewed
-
Effectiveness of prenatal intensive counselling on knowledge, attitude and acceptance of post placental intrauterine contraceptive device among mothersM Shanthini,Manjubala Dash*,A Felicia Chitra,S Jayanthi,P Sujatha. Effectiveness of prenatal intensive counselling on knowledge, attitude and acceptance of post placental intrauterine contraceptive device among mothers. Clin J Obstet Gynecol. 2020: doi: 10.29328/journal.cjog.1001044; 3: 021-025
-
Timely initiation of breastfeeding and associated factors among mothers who have infants less than six months of age in Gunchire Town, Southern Ethiopia 2019Ephrem Yohannes*,Tsegaye Tesfaye. Timely initiation of breastfeeding and associated factors among mothers who have infants less than six months of age in Gunchire Town, Southern Ethiopia 2019. Clin J Obstet Gynecol. 2020: doi: 10.29328/journal.cjog.1001045; 3: 026-032
-
Amenorrhea-An abnormal cessation of normal menstrual cycleNida Tabassum Khan*,Namra Jameel . Amenorrhea-An abnormal cessation of normal menstrual cycle. Clin J Obstet Gynecol. 2020: doi: 10.29328/journal.cjog.1001046; 3: 033-036
-
Maternal, neonatal and children´s health in Sub-Saharan East AfricaJosef Donát*. Maternal, neonatal and children´s health in Sub-Saharan East Africa. Clin J Obstet Gynecol. 2020: doi: 10.29328/journal.cjog.1001049; 3: 043-045
-
Determinants of neonatal near miss among neonates admitted to Ambo University Referral Hospital and Ambo General Hospital, Ethiopia, 2019Ephrem Yohannes*,Nega Assefa,Yadeta Dessie. Determinants of neonatal near miss among neonates admitted to Ambo University Referral Hospital and Ambo General Hospital, Ethiopia, 2019. Clin J Obstet Gynecol. 2020: doi: 10.29328/journal.cjog.1001050; 3: 046-053
Most Viewed
-
Feasibility study of magnetic sensing for detecting single-neuron action potentialsDenis Tonini,Kai Wu,Renata Saha,Jian-Ping Wang*. Feasibility study of magnetic sensing for detecting single-neuron action potentials. Ann Biomed Sci Eng. 2022 doi: 10.29328/journal.abse.1001018; 6: 019-029
-
Evaluation of In vitro and Ex vivo Models for Studying the Effectiveness of Vaginal Drug Systems in Controlling Microbe Infections: A Systematic ReviewMohammad Hossein Karami*, Majid Abdouss*, Mandana Karami. Evaluation of In vitro and Ex vivo Models for Studying the Effectiveness of Vaginal Drug Systems in Controlling Microbe Infections: A Systematic Review. Clin J Obstet Gynecol. 2023 doi: 10.29328/journal.cjog.1001151; 6: 201-215
-
Causal Link between Human Blood Metabolites and Asthma: An Investigation Using Mendelian RandomizationYong-Qing Zhu, Xiao-Yan Meng, Jing-Hua Yang*. Causal Link between Human Blood Metabolites and Asthma: An Investigation Using Mendelian Randomization. Arch Asthma Allergy Immunol. 2023 doi: 10.29328/journal.aaai.1001032; 7: 012-022
-
Impact of Latex Sensitization on Asthma and Rhinitis Progression: A Study at Abidjan-Cocody University Hospital - Côte d’Ivoire (Progression of Asthma and Rhinitis related to Latex Sensitization)Dasse Sery Romuald*, KL Siransy, N Koffi, RO Yeboah, EK Nguessan, HA Adou, VP Goran-Kouacou, AU Assi, JY Seri, S Moussa, D Oura, CL Memel, H Koya, E Atoukoula. Impact of Latex Sensitization on Asthma and Rhinitis Progression: A Study at Abidjan-Cocody University Hospital - Côte d’Ivoire (Progression of Asthma and Rhinitis related to Latex Sensitization). Arch Asthma Allergy Immunol. 2024 doi: 10.29328/journal.aaai.1001035; 8: 007-012
-
An algorithm to safely manage oral food challenge in an office-based setting for children with multiple food allergiesNathalie Cottel,Aïcha Dieme,Véronique Orcel,Yannick Chantran,Mélisande Bourgoin-Heck,Jocelyne Just. An algorithm to safely manage oral food challenge in an office-based setting for children with multiple food allergies. Arch Asthma Allergy Immunol. 2021 doi: 10.29328/journal.aaai.1001027; 5: 030-037

If you are already a member of our network and need to keep track of any developments regarding a question you have already submitted, click "take me to my Query."


